
Figure 4.
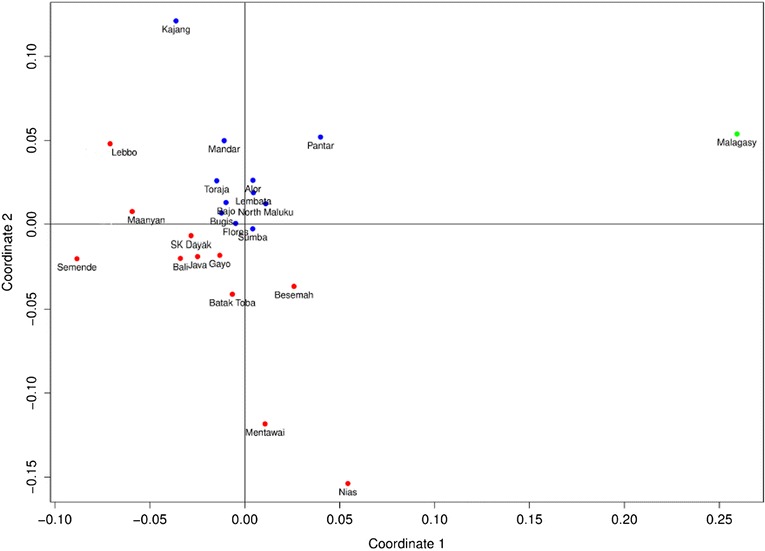
MDS plot showing F ST values between Indonesian and Malagasy populations based on mtDNA haplogroup frequencies (Kruskal stress: 0.143). Red: western Indonesians; blue: eastern Indonesians.
Official websites use .gov
A
.gov website belongs to an official
government organization in the United States.
Secure .gov websites use HTTPS
A lock (
) or https:// means you've safely
connected to the .gov website. Share sensitive
information only on official, secure websites.
MDS plot showing F ST values between Indonesian and Malagasy populations based on mtDNA haplogroup frequencies (Kruskal stress: 0.143). Red: western Indonesians; blue: eastern Indonesians.