
Figure 3.
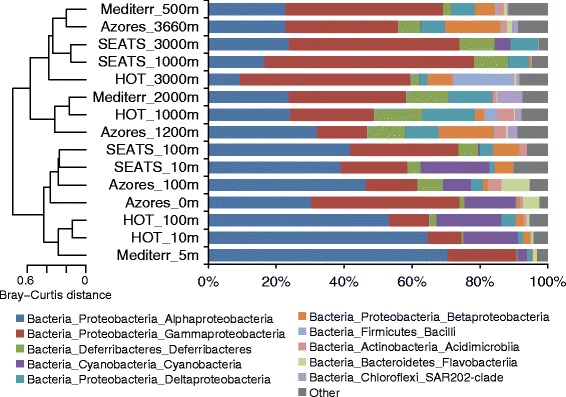
Clustering analysis of bacterial communities in the SCS and other oceans. Hierarchical clustering was performed using complete linkage on Bray–Curtis distance measures of 94 bacterial classes assigned to tag sequences of 16S rRNA hypervariable V6 region. Only the abundant classes (averaged from all samples) are included in the stacked bar chart for clarity. The remaining classes are collapsed into one group denoted as “Other”.