
Figure 5.
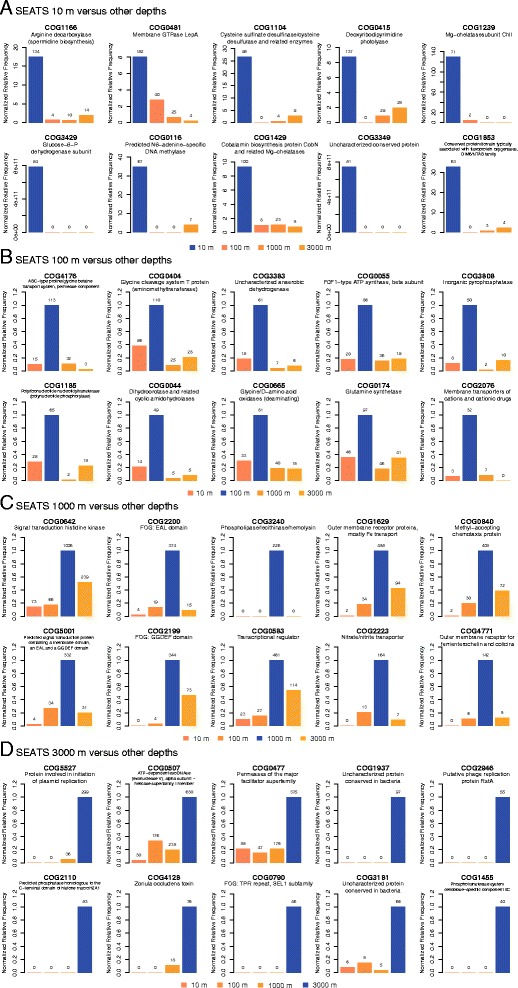
Enriched functional genes at (A) 10-, (B) 100-, (C) 1000-, and (D) 3000-m pelagic zones at the SEATS station. The original counts of each functional gene are labeled on top of each bar.
Official websites use .gov
A
.gov website belongs to an official
government organization in the United States.
Secure .gov websites use HTTPS
A lock (
) or https:// means you've safely
connected to the .gov website. Share sensitive
information only on official, secure websites.
Enriched functional genes at (A) 10-, (B) 100-, (C) 1000-, and (D) 3000-m pelagic zones at the SEATS station. The original counts of each functional gene are labeled on top of each bar.