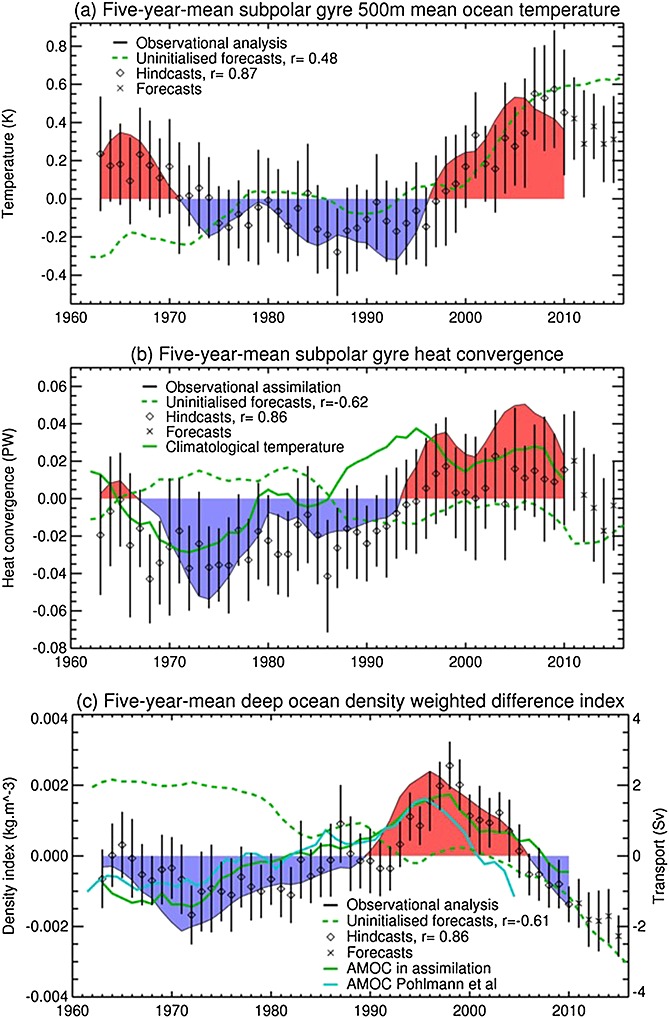
Figure 1.

Hindcasts, uninitialized forecasts, forecasts and observational analyses or assimilations for 5 year mean (years 1–5) anomalies of (a) SPG temperature averaged over the upper 500 m, (b) ocean heat transport convergence into the SPG, and (c) deep Atlantic density index (see text). The year indicates the central year in the 5 year mean. Also shown in Figure 1c is the AMOC at 45°N from Pohlmann et al. [2013], scaled to have the same standard deviation as the AMOC in the assimilation. Red/blue shading is the same as the black line. The 90% probability spread of the hindcasts/forecasts is indicated by the vertical lines. Figure 1a uses additional trend correction following Kharin et al. [2012].
