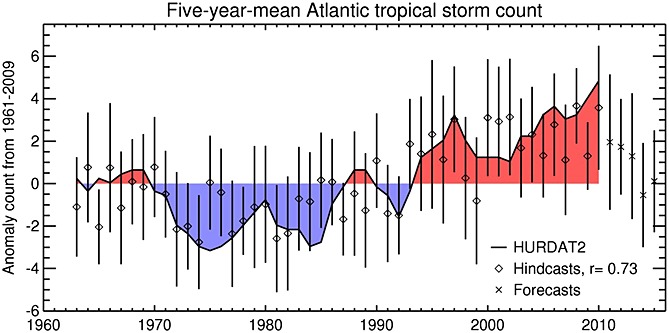
Figure 4.

Tropical storm counts for storms in the latitude band 5°N–25°N in the Atlantic that last more than 2 days. The year indicates the central year of the 5 year mean. Following Smith et al. [2010], model storms are tracked in daily field of sea level pressure and standardized to have the same mean and variance as the observations. The 50% probability spread of the hindcasts/forecasts is indicated by the vertical lines.
