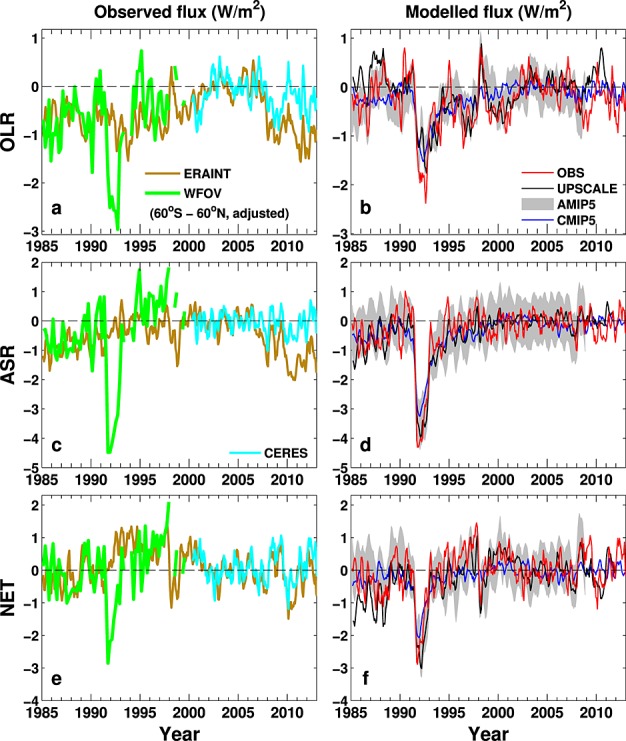
Figure 2.

Changes in (a, c, e) observed and (b, d, f) simulated/reconstructed global mean deseasonalized anomalies (relative to the 2001–2005 period) of outgoing longwave radiation (Figures 2a and 2b), absorbed solar radiation (Figures 2c and 2d), and net downward radiation at the top of the atmosphere (Figures 2e and 2f). Three-month running means are applied. Gray shading denotes the ±1 standard deviation of the nine AMIP5 simulations. WFOV 72day mean data are deseasonalized with respect to the 1985-99 period and for clarity is adjusted so multiannual 60∘S–60∘N mean anomalies match corresponding ERAI global mean anomalies (Figures 2a, 2c, and 2e).
