
Figure 2.
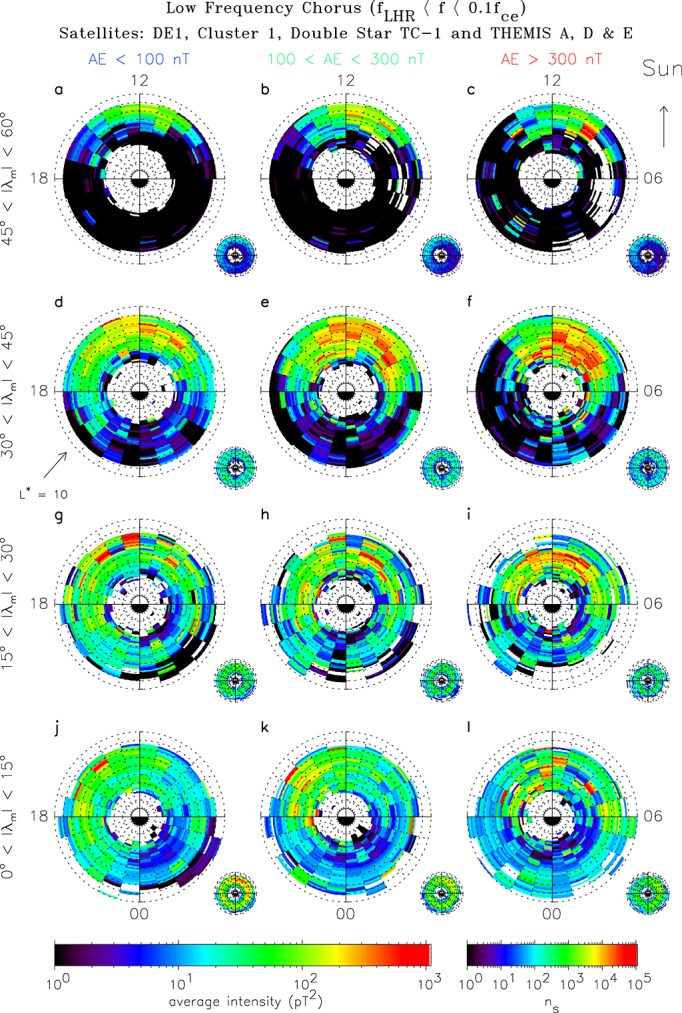
Global maps of the average wave intensity of low-frequency chorus as a function of L∗ and MLT for, from bottom to top, increasing magnetic latitude and, from left to right, increasing geomagnetic activity. The plots extend linearly out to L∗ = 10 with noon at the top and dawn to the right. The average intensities are shown in the large panels and the corresponding sampling distributions in the small panels.