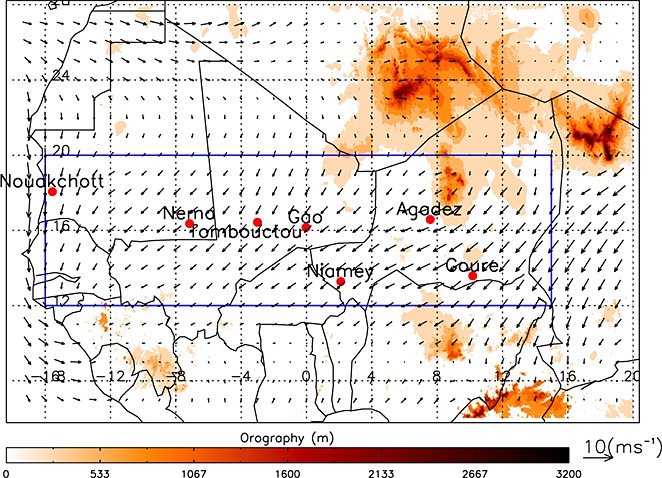
Figure 1.

Map showing the location of the seven Sahelian stations used in this study (red dots with labels), the orography (shaded in m above mean sea level according to the legend), and the domain used for averaging ERA-Interim reanalysis data in blue. Winter mean (December–February) 10 m wind vectors from ERA-Interim are also included (scale in bottom right corner).
