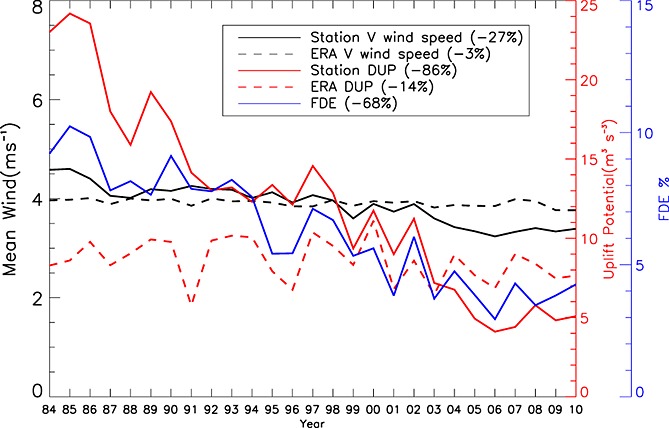
Figure 2.

Trends in mean annual 10 m wind speed (V, black lines), dust uplift potential (DUP, red lines), and frequency of dust events (FDE, blue line) from observations averaged over seven surface stations in the Sahel (see Figure 1 for locations; solid lines) and ERA-Interim reanalysis averaged over the blue box shown in Figure 1 (dashed lines) for the time period 1984–2010. Numbers in brackets in the legend indicate the relative change over the time period estimated from the linear trend line as in Table 1. Definitions of DUP and FDE are given in section 2. Note that there is no FDE from reanalysis data. A fixed threshold of 7 ms–1 was used for the DUP computations.
