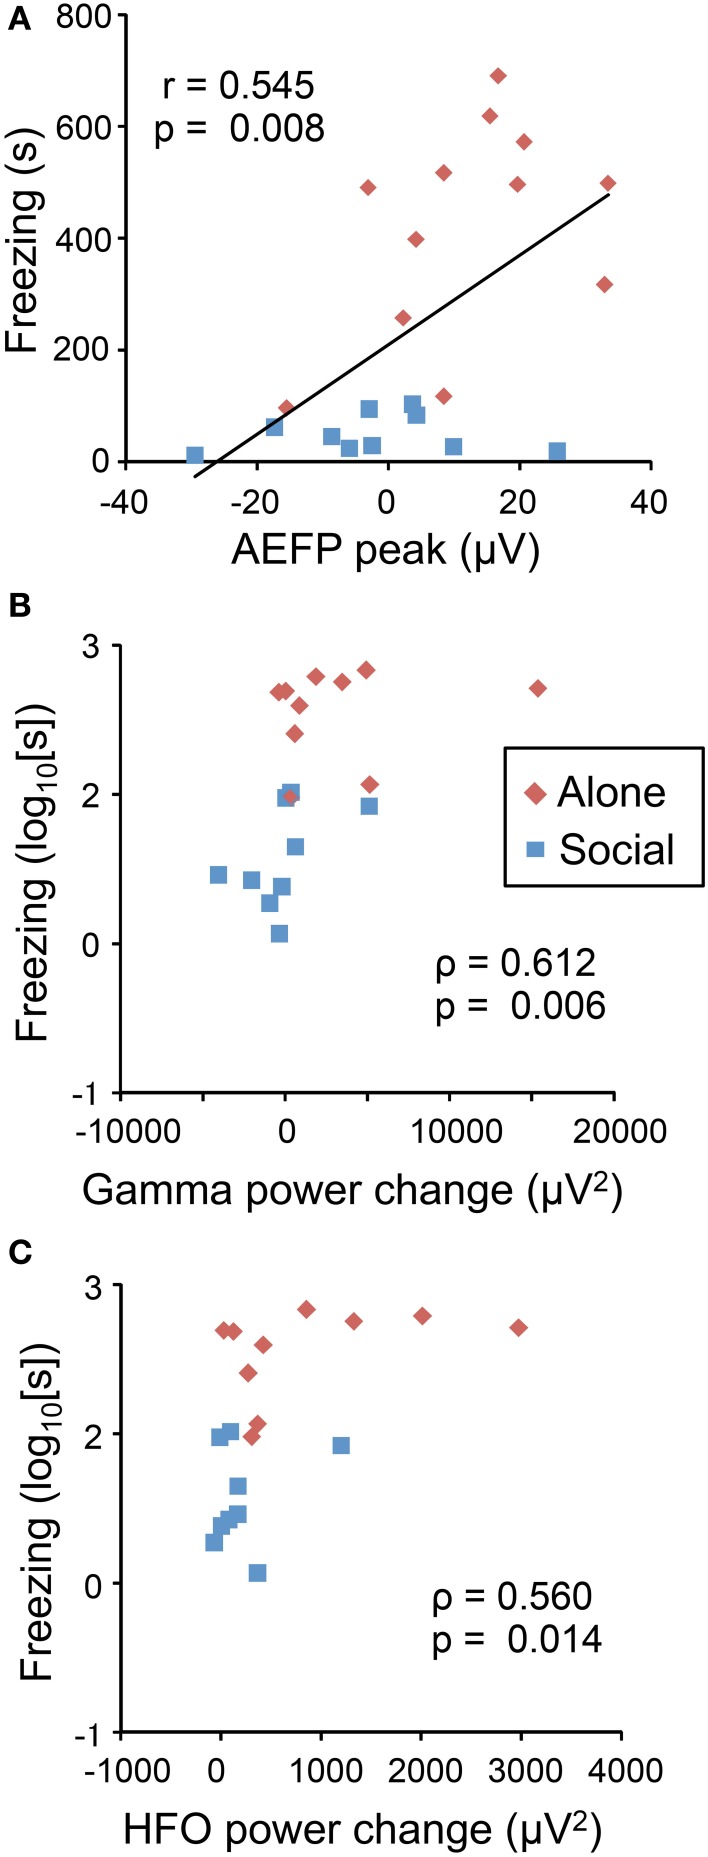
Figure 4.
Correlation between neurophysiological responses to the CS and freezing behaviors. Freezing duration positively correlated with AEFP peak amplitude (A), power change of gamma oscillations (B), and power change of HF oscillations (C). Red and blue dots indicate the data from individual rats in the Alone or Social condition, respectively. Values in the figures indicate Pearson's (r, A) and Spearman's correlation coefficients (ρ, B,C), and the corresponding p-values.

