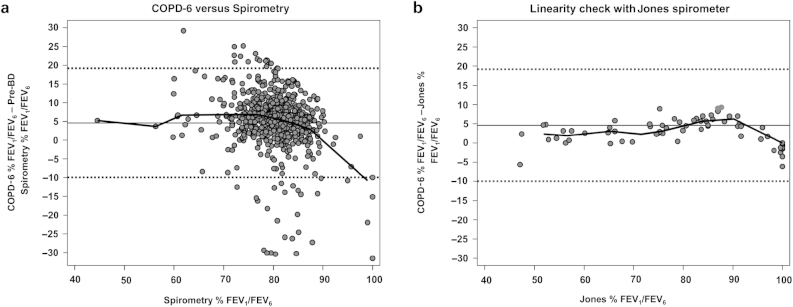
Figure 3.

Bland–Altman plot comparing: (a) the FEV1/FEV6 (%) obtained from Vitalograph COPD-6 6-SS with that obtained from pre-bronchodilator spirometry, (b) FEV1/FEV6 (%) from COPD-6 with that obtained in the laboratory from the flow-volume calibration syringe. Horizontal dotted lines at about 10 and 20 indicate the limits of agreement of the % FEV1/FEV6 difference (within 2 standard deviations of the mean difference). The line over the points corresponds to the median band of the % FEV1/FEV6 difference.
