
Figure 5.
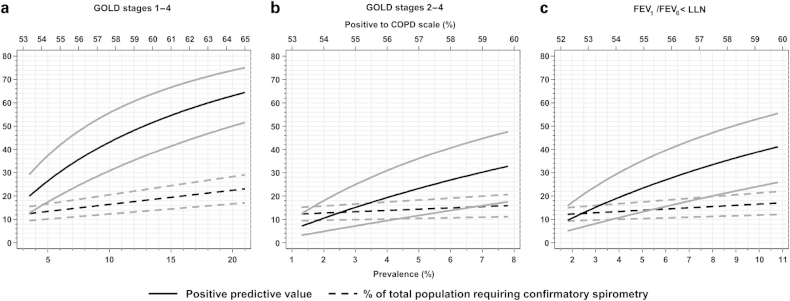
Projected percent of the total population positive to the COPD scale, combined positive predictive value and percent of the total population requiring confirmatory spirometry under serial screening with COPD scale and 6-SS, calculated for a range of COPD prevalence values (with 3 COPD definitions, graph a, b, c). Grey lines around means correspond to 95% confidence intervals.