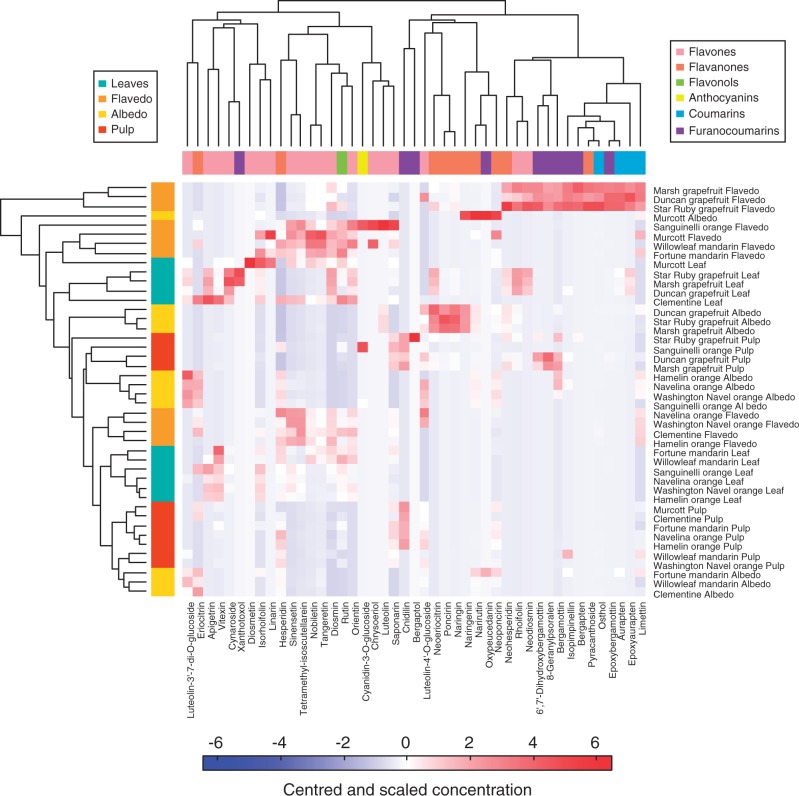
Fig. 2.
Heat map illustrating the patterns of phenolic compound across 11 Citrus cultivars and four tissues: leaves, flavedo, albedo and pulp. Forty-five phenolic compounds were quantified in these tissues with the UPLC–MS method developed in this study, and the values shown correspond to the means of five observations. The dataset comprised centred and scaled values. Colours vary from blue for low concentrations to red for high concentrations. The two classifications of metabolites on the one hand and observations (tissues of cultivars) on the other hand were based on Euclidian distances. The colour codes of the two classifications correspond to the different tissues and to the different classes of metabolites, as indicated in the two keys. The heat map clearly illustrates the separation between tissues and between cultivars.

