Figure 5.

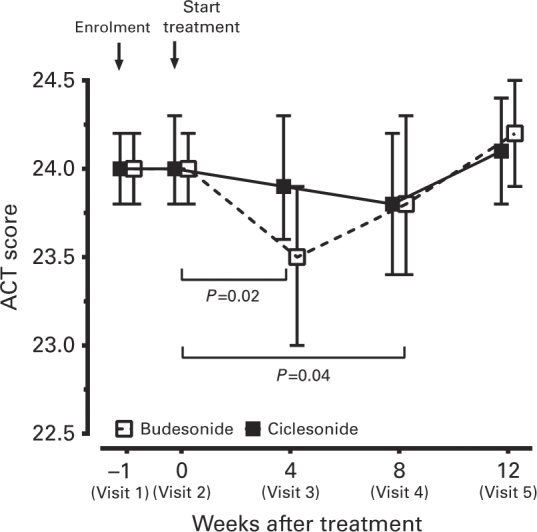
Asthma control test (ACT) scores after 4, 8 and 12 weeks of treatment compared with baseline. Data were expressed as mean±95% CI. The P values were calculated by generalised estimating equations (GEE).

Asthma control test (ACT) scores after 4, 8 and 12 weeks of treatment compared with baseline. Data were expressed as mean±95% CI. The P values were calculated by generalised estimating equations (GEE).