
FIGURE 3.
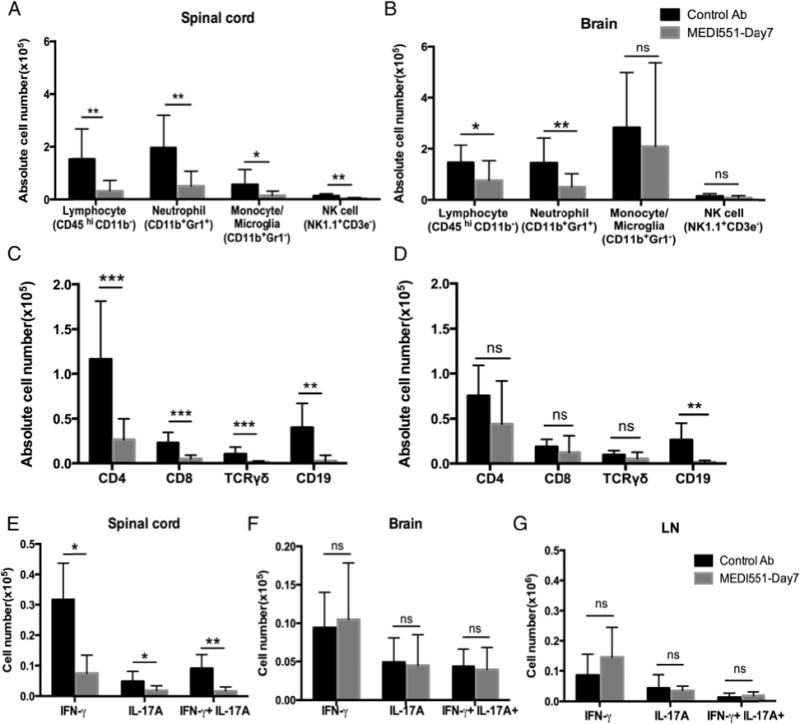
MEDI551 day 7 treatment suppresses immune cell infiltration and decreases cytokine-producing encephalitogenic T cell frequency in the spinal cord. At peak of the disease (days 14–16), brain and spinal cord mononuclear cells or bulk draining LNs from mice treated with MEDI551 or control Ab on day 7 were isolated for FACS analysis to identify leukocyte subsets or cytokine-producing T cells. (A–D) CNS cells were analyzed using our 10-color survey panel. The frequency of each major leukocyte subset (A and B) and lymphocyte subset (C and D) was presented for spinal cord (A and C) and brain (B and D). (E–G) CNS or LN cells were stimulated with PMA/ionomycin mixture before intracellular staining of cytokines followed by flow cytometry analysis. Data shown are the absolute cell count of each cytokine-producing T subset. Error bars indicate SEM. Data from eight mice per group are shown. Data are representative of three independent experiments. *p, 0.05, **p, 0.01, ***p, 0.001.