
Fig 5.
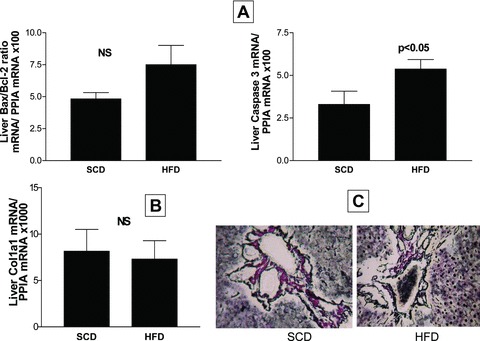
Liver mRNA expression of apoptosis-related genes (Bax, Bcl2 and caspase 3) (A) and a fibrosis-related gene (Col1a1) (B), assessed by quantitative real-time PCR in each experimental group. Each bar represents the mean ± S.E. values of 10 and 15 animals in SCD and HFD, respectively. In each sample, the gene expression was normalized to the expression of cyclophilin A and multiplied by 100/1000 as shown. Bax: Bcl2-associated X protein; Bcl2: B-cell CLL/lymphoma 2; Casp3: caspase 3; Col1a1: collagen type I α1. (C) Gomori’s reticulin silver impregnation of liver sections at the end of the experiment using a representative rat from each experimental group. Figure shows comparisons of the reticulin pattern of the portal tract and hepatic parenchyma across groups.