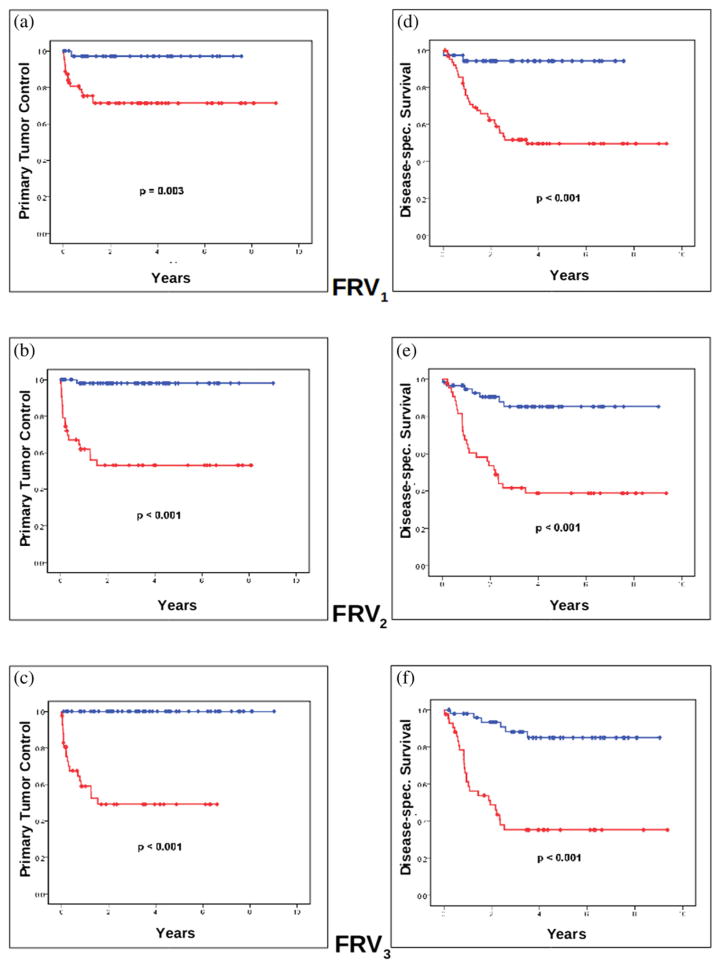
Fig. 2.
Kaplan-Meier analysis of primary tumor control and disease-specific survival. Kaplan-Meier estimates differentiate primary tumor control rate vs. tumor recurrence for (a) FRV1, (b) FRV2, and (c) FRV3. Kaplan-Meier estimates for disease-specific survival rate vs. death from disease for (d) FRV1, (e) FRV2, and (f) FRV3. The blue graphs indicate groups with FRV above cutpoint, the red graphs groups below the FRV cutpoint. More detailed statistical analysis is summarized in Tables 3 and 4. FRV = functional risk volume; spec. = specific.

