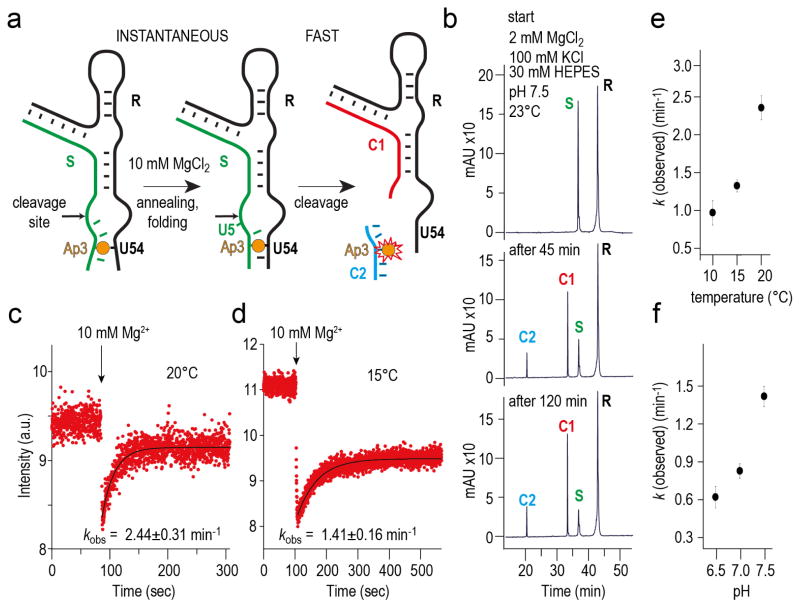
Figure 6. Cleavage kinetics of the env22 twister ribozyme analyzed by 2-aminopurine fluorescence.
a, Schematics of the assay indicating AP position, P1 folding, and cleavage product release. b, Cleavage of the U3AP–A54U variant analyzed by HPLC (for conditions see caption of Fig. 5). c, Fluorescence response of the U3AP–A54U variant upon MgCl2 addition; conditions: cRNA = 0.3 mM, 50 mM KMOPS, 100 mM KCl, 20 C, pH 7.5; mixing was performed manually in less than one or two seconds resulting in 10 mM Mg2+ concentration. d, Same as panel c, but 15 C. e, Plot of apparent rates kobs vs temperature. f, Plot of apparent rates kobs vs pH value.

