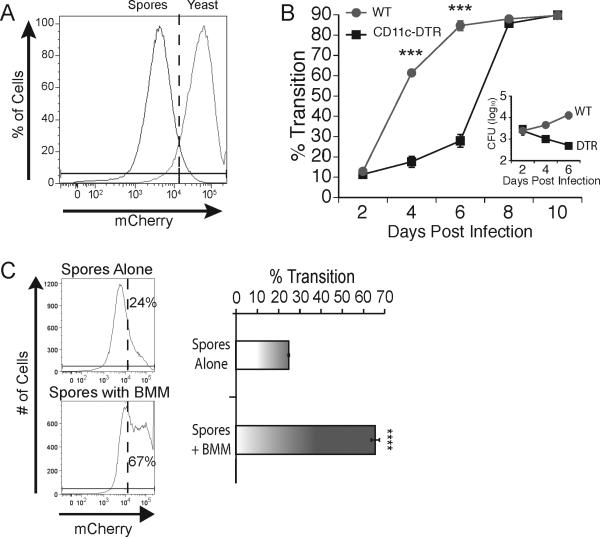
Figure 6. Macrophages accelerate phase transition of spores to yeast.
(A) Flow cytometric analysis of mCherry expression on spores and yeast. (B) Chimeric WT and CD11c-DTR mice treated with DTx in figure 4 were infected with mCherry 14081 spores. The percentage of B. dermatitidis that underwent transition from spore to yeast in lung homogenates was defined as the proportion of mCherry events that were brighter than the threshold defined by FACS in panel A. The inset shows the CFU in these mice on the same time scale. Results are the mean±SEM of 3 mice/group, and are representative of two experiments. (C) mCherry 14081 spores were cultured in vitro in medium alone or with BMM at a MOI of 0.1 for 4 days and analyzed by flow cytometry for intensity of mCherry expression. Expression of mCherry beyond the dotted line was defined as transition to the yeast phase defined by FACS in panel A. Results in the left panel are that of representative wells. The right panel shows the percent of events that were mCherry high (yeast) quantified and averaged among triplicate wells. Results are the mean±SEM and representative of 3 experiments. ***P <0.001, ****P<0.0001.

