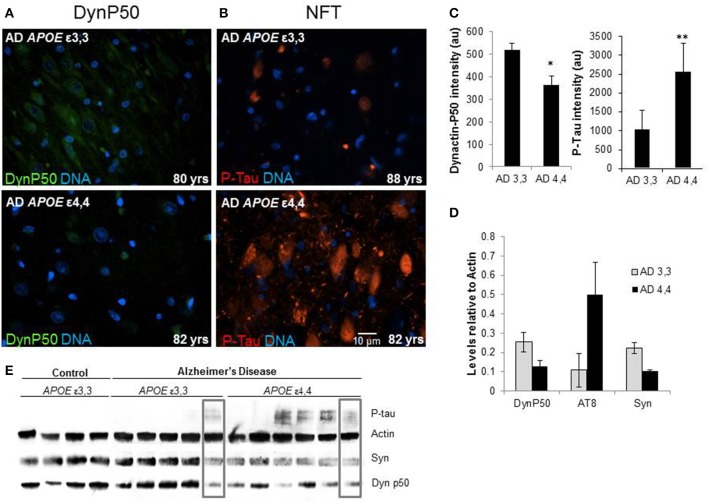
Figure 6.
Comparison of tissue levels of dynactin-P50 (DynP50), P-tau, and synaptophysin (Syn) in Alzheimer patients with APOE ε3,3 vs. ε4,4. (A) Dynactin-P50 (green) was less in AD patients with APOE ε4,4, than in those with ε3,3, while (B) P-tau was increased in ε4,4. Representative images. (C) Fluorescence intensity quantification of P-tau and dynactin-P50 levels in AD patients with ε3,3 vs. ε4,4. (D) Steady state protein levels, relative to that of actin, of P-tau in Alzheimer patients with ε3,3 were lower than levels in those with ε4,4, while synaptophysin and dynactin-P50 levels were higher in ε3,3 compared with ε4,4. (E) Western blot comparison of protein levels in AD vs. Control, and between AD ε3,3 vs. AD ε4,4. Actin was used as loading control. Lanes in gray boxes demonstrate a patient with APOE ε3,3 genotype with similar levels of proteins to those in a patient with APOE ε4,4 genotype, suggestive of the possible presence of Alzheimer risk factors aside from APOE genotype. Wilcoxon-Mann-Whitney Rank Sum Test was used for statistical significance, with *denoting p ≤ 0.05 and **denoting p ≤ 0.01. Data reported as group mean with error bars denoting SEM.

