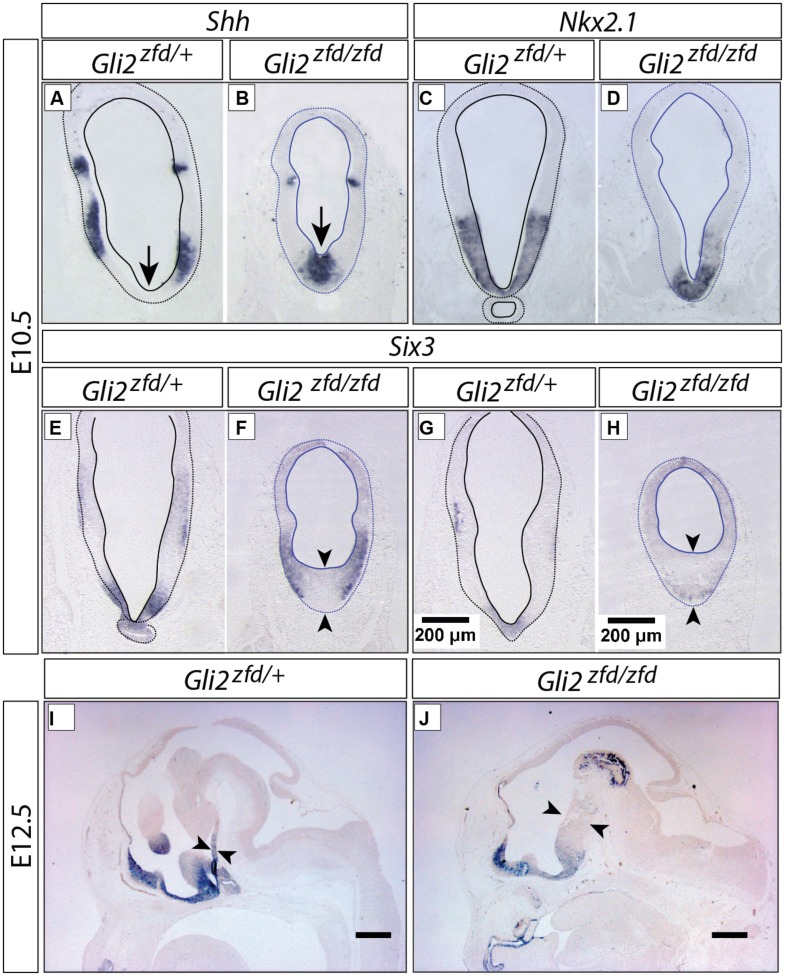
FIGURE 5.
Abnormal medial domain in the Gli2zfd/zfd mutant. (A–H) In situ detection of gene expression on forebrain sections of E10.5 embryos, genotypes, and markers as indicated. In (E–H), pituitary (E,G) and median eminence (F,H) levels are shown. Scale bar in (G,H), 200 μm. (I,J) In situ detection of Six3 expression on sagittal sections of E12.5 WT (A) and Gli2zfd/zfd (B) mouse embryos. Arrows show thickness of midline. Scale bars, 500 μm.

