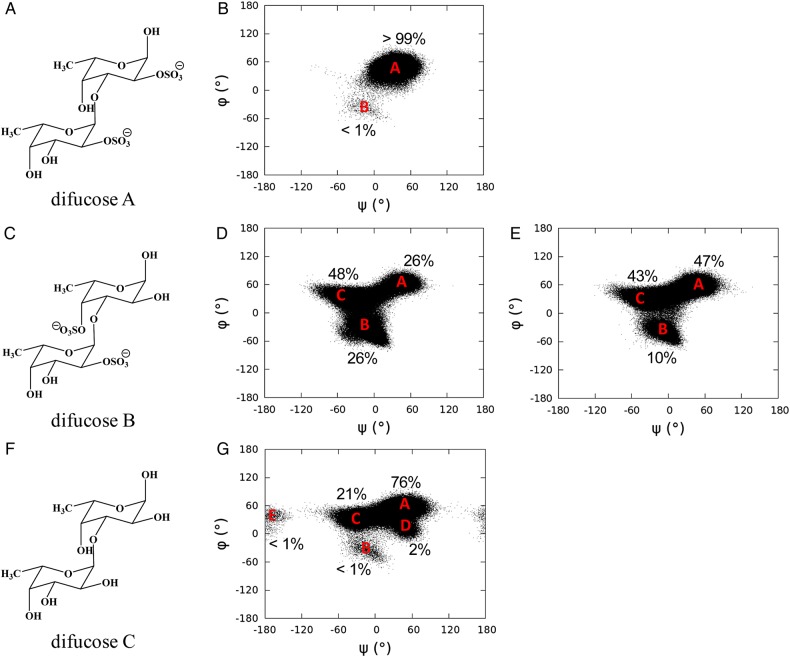
Fig. 7.
Chemical structures of difucose A (A), difucose B (C) and difucose C (F); dihedral angle (ψ/φ) distributions of difucose A (B), difucose B (D), difucose C (G) in the MD simulation and difucose B (E) in the MD simulation with atomic charges of sulfate groups turned off. Each dot in panels represents a trajectory frame in the MD simulation.

