
Fig 3.
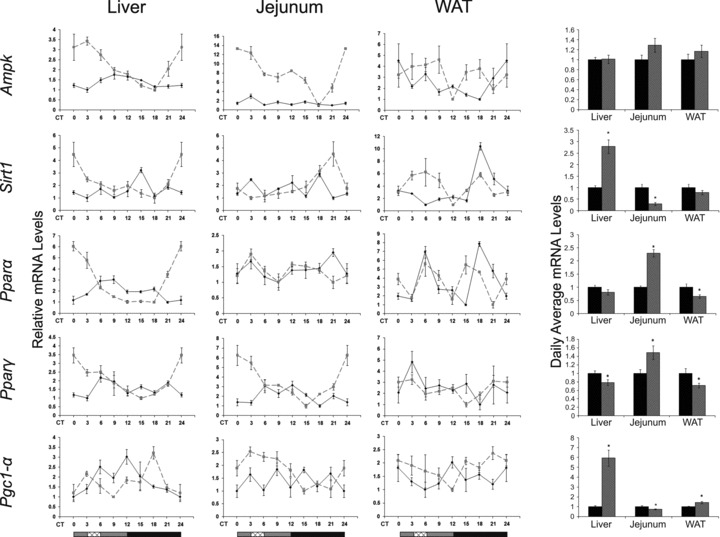
Circadian rhythms and average mRNA levels of metabolic markers in the liver, jejunum and WAT of AL- and RF-fed mice. Liver and jejunum were collected every 3 hrs around the circadian cycle from mice fed either AL (solid black line and columns) or RF (dashed grey line and grey columns). Food availability during RF is marked by the crosshatched box. mRNA was quantified by real-time PCR and is plotted as relative levels. Metabolic gene levels were normalized using Gapdh as the reference gene. For total daily levels, all time-points were averaged. The grey and black bars designate the subjective day and night, respectively. Values are means ± S.E., n = 4 for each time-point in each group. Asterisk denotes significant difference (P < 0.05).