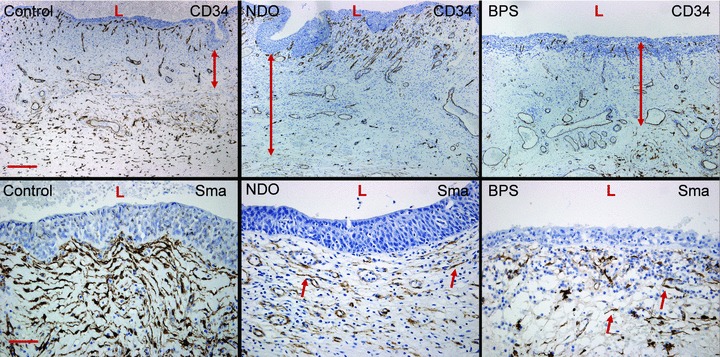
Fig 6.

Upper panels illustrate the increased width of the ULP cell area in NDO bladders, by means of the CD34– population of ULP ICLC (double arrows). Scale bar equals 200 μm. Lower panels show the decreased α-sma-expression on ULP ICLC (arrows) in both NDO and BPS bladders. Scale bar: 50 μm. L: lumen.
