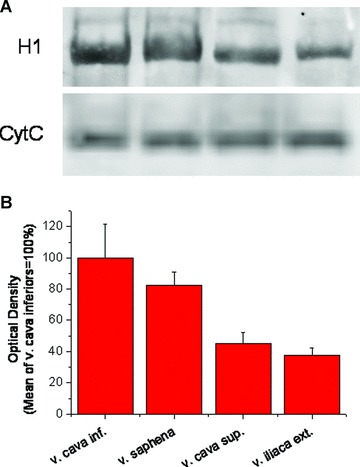
Fig 4.

H1 histamine receptor expression in various rabbit veins. (A) Specific H1 immunopositive bands at ∼55 kD of a representative immunoblot and corresponding CytC staining. (B) Optical density of H1 immunopositive bands, normalized to CytC. n ≥ 3 in each group.
