Fig 1.

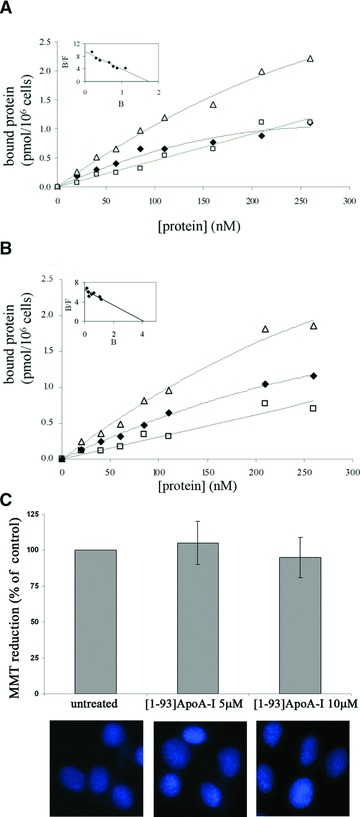
Binding of [1–93]ApoA-I to cultured cells and its effects on cell viability. Binding curves were obtained incubating H9c2 cells (A) or HepG2 cells (B) for 2 hrs at 4°C with increasing concentrations of iodinated [1–93]ApoA-I, in the absence (Δ, total binding) or in the presence (□, non-specific binding) of a 40-fold molar excess of the unlabelled polypeptide. Specific binding values (♦) were obtained by subtracting the values relative to non-specific binding from those of total binding. The linearization of specific binding curves was obtained according to the Scatchard equation (insets of A and B). B: pmoles of protein bound to 1 × 10⁶ cells; F: concentration of the unbound protein. (C) MTT reduction assay and Hoechst staining of H9c2 cells untreated or treated with 5 μM or 10 μM [1–93]ApoA-I. Error bars indicate standard deviations obtained from four independent experiments. All images have been acquired at the same magnification.
