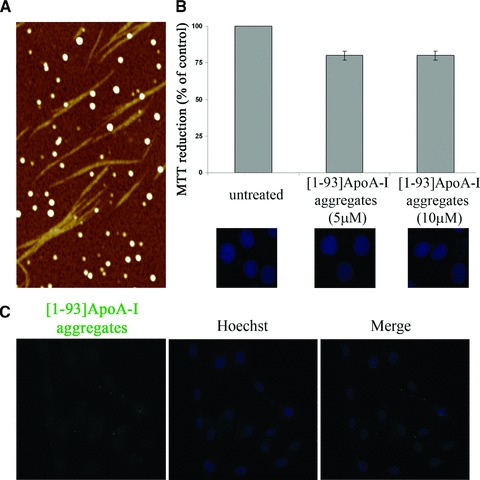
Fig 7.

Analysis of [1–93]ApoA-I fibrils. (A) Tapping mode AFM image (height data) of aggregated [1–93]ApoA-I. Upon incubation in the aggregating conditions, the whole sample was observed. Fibrils coexist with prefibrillar aggregates; spheroidal aggregates are also found. Scan size 3.0 μm, Z range 10 nm. (B) Effects of [1–93]ApoA-I fibrils on cell viability. MTT reduction assay and Hoechst staining of H9c2 cells, untreated or treated with 5 μM or 10 μM [1–93]ApoA-I fibrils, are shown. Error bars indicate standard deviations obtained from three independent experiments. Nuclei images have been acquired at the same magnification. (C) Analysis of internalization of [1–93]ApoA-I fibrils in H9c2 cells. Cells were incubated for 6 hrs with 3 μM FITC-labelled [1–93]ApoA-I fibrils and analysed by epifluorescence microscopy. Nuclei were stained with Hoechst (blue).
