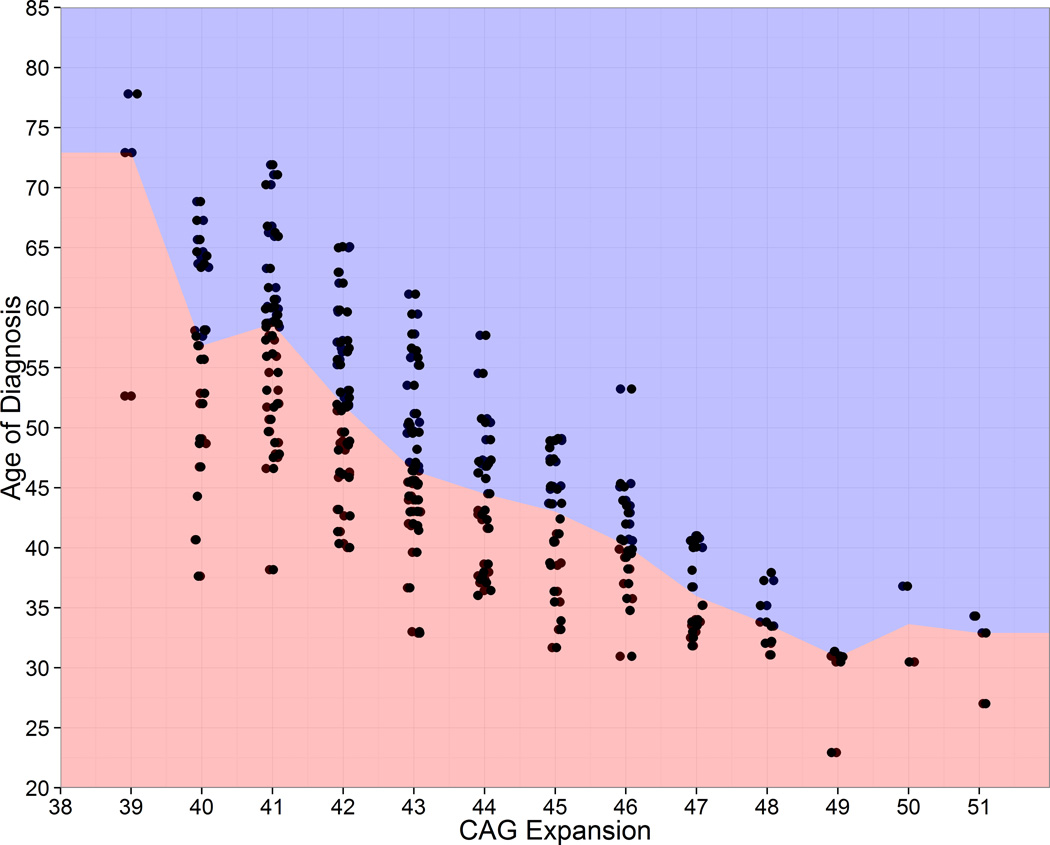
Figure 1. Observed age of diagnosis by CAG expansion for N=225 prospective converters. Observations were slightly jittered horizontally to reveal overlapping cases.
Figure 1 shows age of diagnosis as a function of CAG expansion for the N=225 people who obtained a motor diagnosis during the 12-year PREDICT-HD study (i.e., the converters). None of the individuals in Figure 1 were diagnosed at study entry and all have repeated measures, some with up to 12 years of observations (mean=5 years). The color change is at the median age for each CAG. As seen in the figure, the age at diagnosis can vary widely for individuals with the same CAG expansion. Considering CAG=40, the range is 31 years, and the difference between the first and third quartile is 15 years. The variability is indicative of the need to include variables in addition to CAG expansion with the goal of improving the accuracy of predicting the time of diagnosis. The main goal of this study is to improve predictive accuracy by identifying variables that are correlated with diagnosis, over and above CAG expansion. CAG=cytosine-adenine-guanine.

