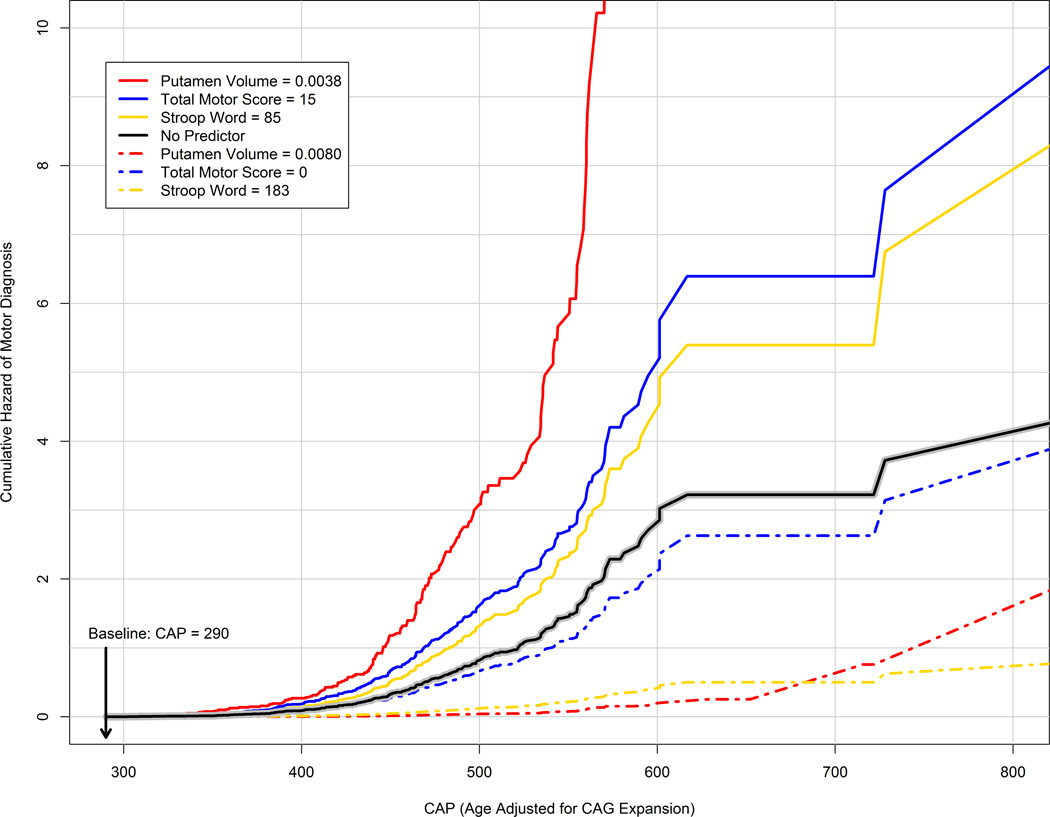
Figure 2. Cumulative hazard (accumulated risk rate) of motor diagnosis by CAG-Age Product (CAP) for various baseline predictor values.
CAP is age corrected for CAG expansion and is the time metric of the horizontal axis. The solid black line denotes the cumulative hazard for a model with no predictor representing prediction based only on CAG and age (as summarized by CAP). The dash-dot lines are risk profiles for predictors representing no deterioration at baseline (e.g., Total Motor Score=0), whereas the colored solid lines are risk profiles for predictors representing advanced deterioration at baseline (e.g., Total Motor Score = 15). Putamen volume is ICV-corrected. As a reference, CAP=290 corresponds to age 31 and CAP=600 corresponds to age 64 for a person with CAG=43 (the sample mean). CAP=Age × (CAG − 33·66).CAG=cytosine-adenine-guanine.

