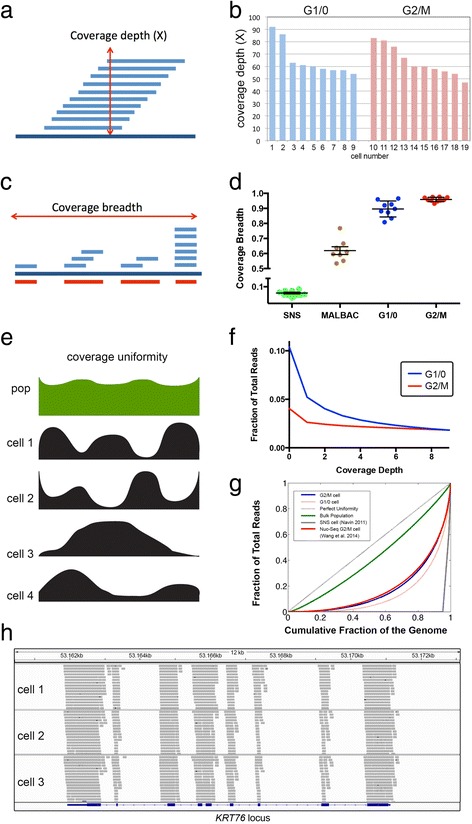
Figure 2.

Coverage performance and metrics. (a) Coverage depth diagram. (b) Coverage depth data for G1/0 and G2/M single cells. (c) Coverage breadth diagram. (d) Coverage breadth data for exome region of G1/0 and G2/M single cells compared to previous studies using SNS [7] and MALBAC (Ni et al. [28]). Error bars show SEM. (e) Coverage uniformity diagram. (f) Coverage depth distribution for sites with low coverage in G1/0 and G2/M single cells. (g) Lorenz curves of coverage uniformity, showing values for perfect coverage, millions of SKN2 reference cells, Nuc-Seq single cell [11], single cells from G1/0 and G2/M distributions, and SNS cell [7]. (h) Capture performance of sequence reads across exons in the KRT76 locus for three single cells.
