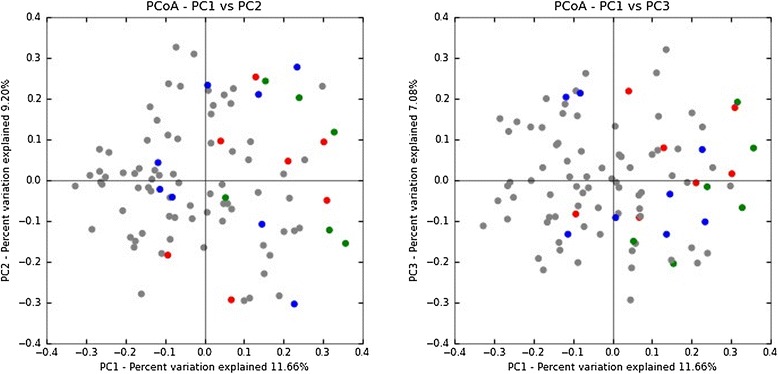
Figure 2.

Principal coordinate analysis (PCoA) of NEC compared to controls. Unweighted UniFrac uses phylogenetic information to compare specimens that can be visualized with PCoA plots. The gray circles represent the control specimens (n = 74), blue circles represent mild NEC specimens (n = 8), red circles represent severe NEC specimens (n = 7), and green circles represent lethal NEC specimens (n = 6). ANOSIM was used to evaluate the UniFrac distances of all NEC vs controls. Although the P value is statistically significant (P = 0.001), the R value (0.2309) suggests that the communities are essentially not separable. PC, principal coordinate.
