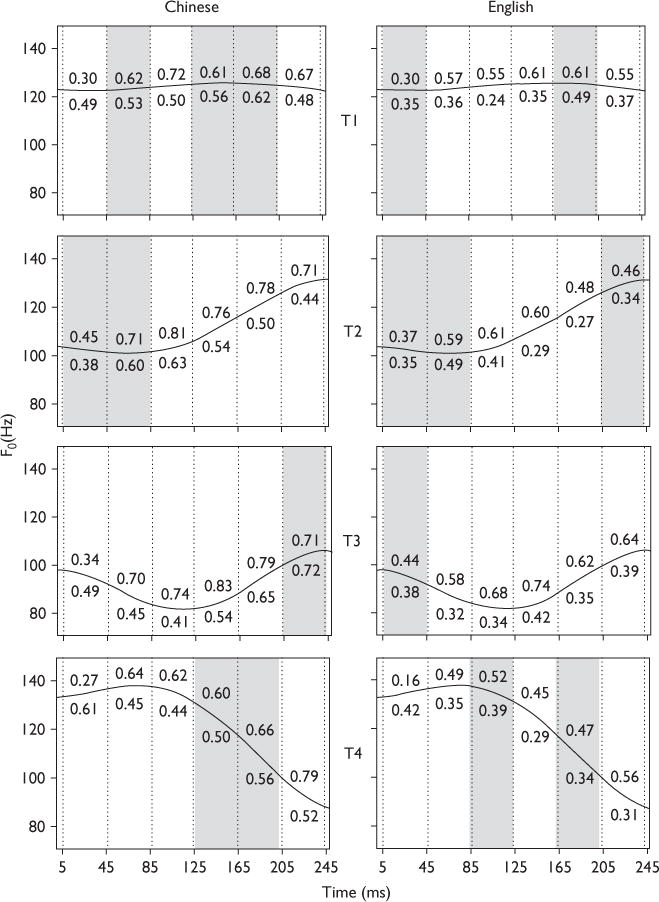
Fig. 1.

Pitch strength of tonal sections derived from the frequency-following response waveforms of Chinese (left) and English participants (right) in response to speech and nonspeech stimuli. The four Mandarin tonal categories are represented by T1, T2, T3, and T4. Consistent across both language groups, in the majority of sections, pitch strength derived in response to speech stimuli (value above the solid line) is greater than response to nonspeech stimuli (value below the solid line). Sections that yield significantly larger pitch strength for the speech stimuli relative to nonspeech stimuli are unshaded; those that are not shaded in gray. Vertical dotted lines demarcate six 40-ms sections within each f0 contour: 5–45, 45–85, 85–125, 125–165, 165–205, and 205–245.
