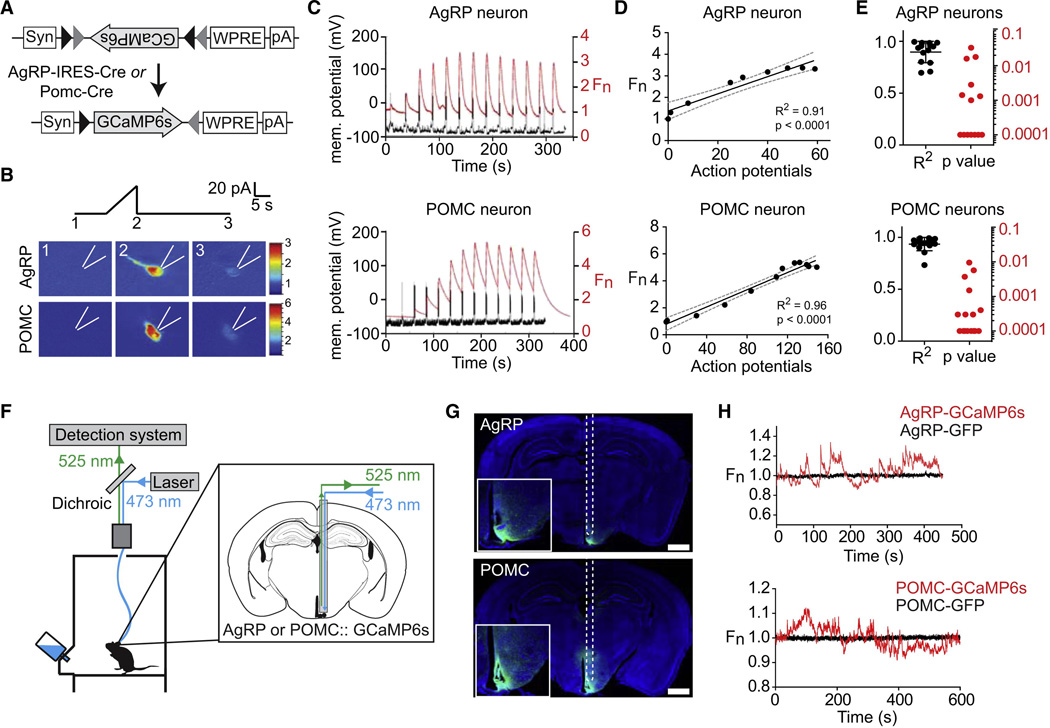
Figure 1. Optical recording of AgRP and POMC neuron activity in awake behaving mice.
(A) FLEX AAV used to drive GCaMP6s expression. (B) Response of AgRP and POMC neurons to current ramp. Scale bar indicates GCaMP6s fluorescence normalized to 1.0 at start of the experiment (Fn). (C) Membrane potential and GCaMP6s fluorescence in response to sequential 10 pA current steps of duration 2s separated by 20s. (D) Relationship between action potential number and fluorescence for cells in panel C. (E) R-squared and p values for the linear regression of fluorescence versus action potential number for 16 POMC and 14 AgRP neurons. (F) Schematic of the fiber photometry setup. (G) Coronal section from AgRP and POMC mice showing path of optical fiber and injection site. Scale bar = 1 mm (H) Fluorescence trace during cage exploration for mice expressing GCaMP6s or GFP in AgRP neurons or POMC neurons. See also Figure S1.

