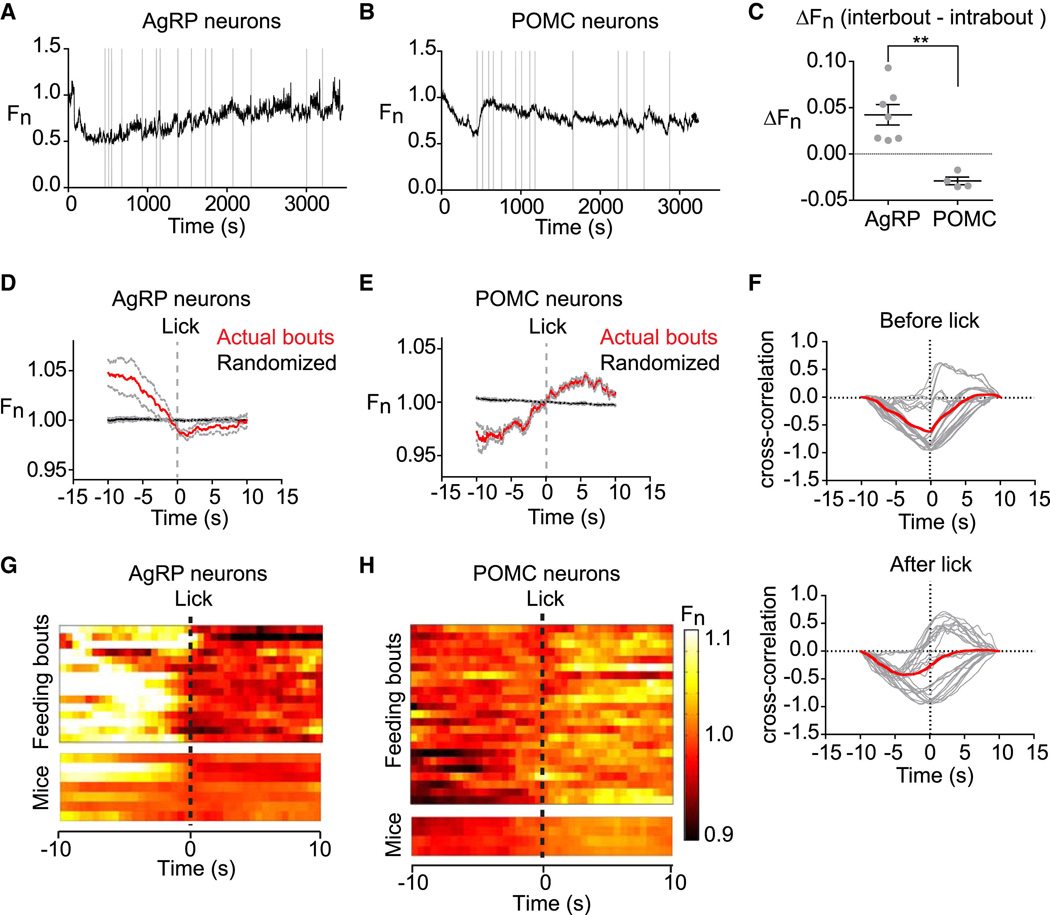
Figure 6. Intrameal dynamics of AgRP and POMC neurons.
(A, and B) Traces of AgRP and POMC activity in mice during consumption of a liquid diet. Licks that mark initiation of a feeding bout are shown in gray. (C) Difference in average fluorescence between periods of feeding (intrabout) and intermeal intervals (interbout) for each mouse. (D, E) Calcium signals from AgRP and POMC neurons aligned to the moment of the first lick that initiates a feeding bout. Data from actual feeding bouts shown in red; data from simulated randomly generated feeding bouts in black. (F) Cross-correlation plots showing the correlation between activity of AgRP and POMC neurons before and after licking. Red is mean, gray is 28 individual comparisons between AgRP (n=7) and POMC (n=4) mice. (G and H) Peri-event plots showing the activity of AgRP and POMC neurons aligned to the start of feeding bouts. The top plot shows all of the bouts for one trial of a mouse. The bottom plot shows the average response across all bouts for 7 AgRP and 4 POMC mice.

