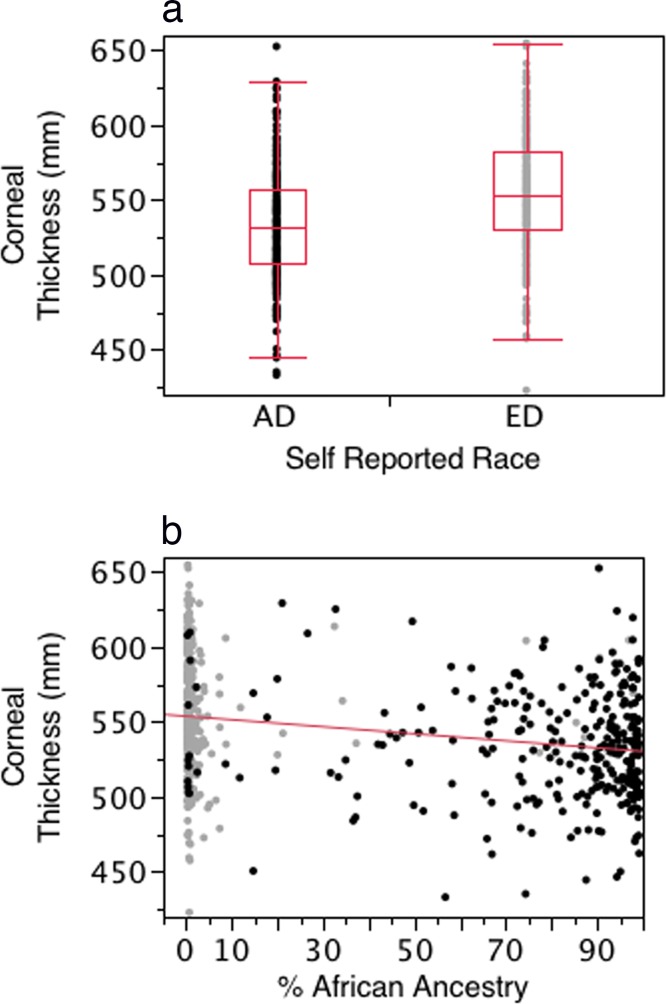
Figure 2.
(a) Box and whisker plot of the distribution of corneal thickness for the AD and ED groups. (b) Scatterplot illustrating the association between the proportion of African ancestry and CCT for the entire cohort. Dark dots indicate ED group, light dots indicate AD group. The associations for self-report and BGA were highly significant (P < 0.0001 for both).

