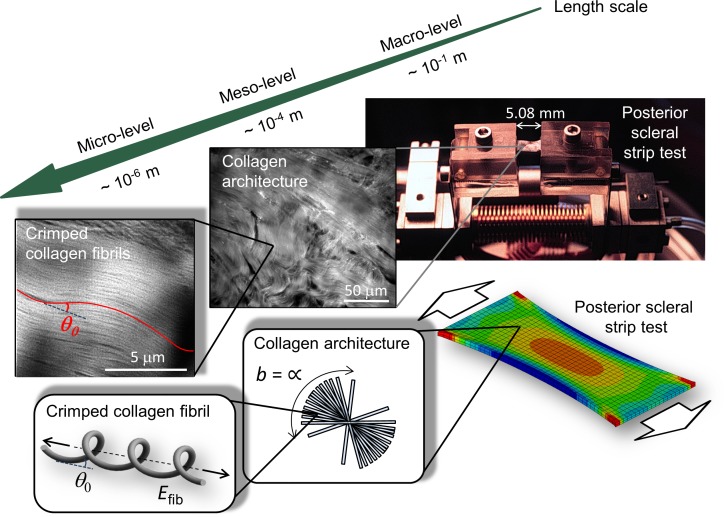
Figure 2.
Tissue structures at multiple scales in the experimental (top) and computational model (bottom). Macro-level: The posterior scleral strip clamped into the uniaxial tensile testing device and the finite element model of the scleral strip test. Meso-level: The collagen architecture showing a random alignment of scleral lamellae in the plane of the sclera, which is represented by a von Mises distribution with concentration parameter b = ∞ in the computer model. Micro-level: Crimped collagen fibrils in the unloaded tree shrew sclera and in the computational model.

