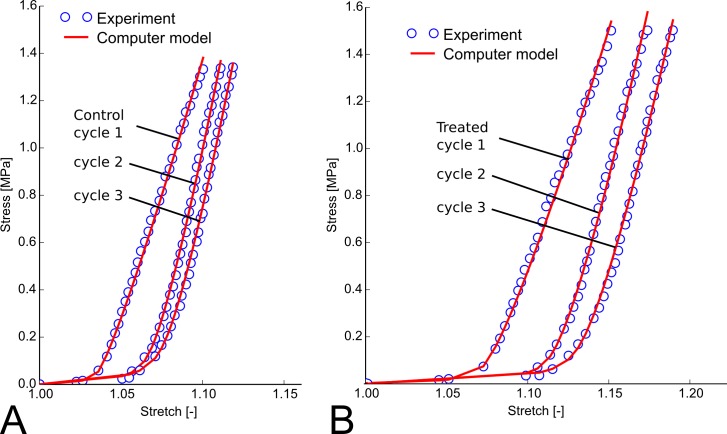
Figure 6.
Typical stress-stretch curves showing the three loading cycles (Load Protocol A) of the control (A) and −5 D lens–treated sclera (B) of one animal after 4 days of −5 D lens wear (lens was worn from 24 to 28 days of VE). The computational model was fitted to each loading curve independently. The computational fits (red lines) matched the experimental measurements (blue circles) well. With increasing load cycles, the stress-stretch curves of both, the control and treated sclera, shift to the right suggesting that the tissue undergoes cyclic softening. The stress-stretch curves of the treated sclera were shifted to the right showing a more pronounced toe region compared with the control tissue.

