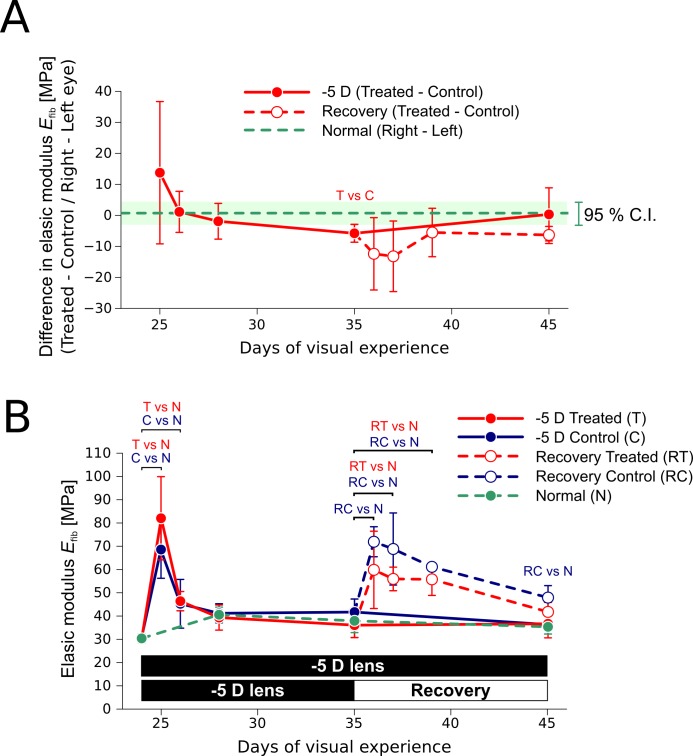
Figure 9.
Fitted elastic modulus of collagen fibrils (Load Protocol A, load cycle 1, mean, SD) during compensation for a −5 D lens (n = 5 per group) and recovery (n = 3 per group). (A) Difference in the fitted elastic modulus between the treated or recovering eye and the control eye. “T vs C” indicates a significant difference (paired t-test, P < 0.05) between the lens-treated eye and the control eye. No significant differences were found between the recovering eye and its control. The average value and 95% confidence interval are shown for the difference between the right and left eyes of normal animals. (B) Absolute values of the fitted elastic modulus. Compared with normal sclera, significant differences (unpaired t-test, P < 0.05) are indicated with text labels for the lens-treated eye (T vs N), the control eye (C vs N), the recovering eye (RT vs N), and the recovering control eye (RC vs N). Please note that each data point is based on an independent set of subjects.

