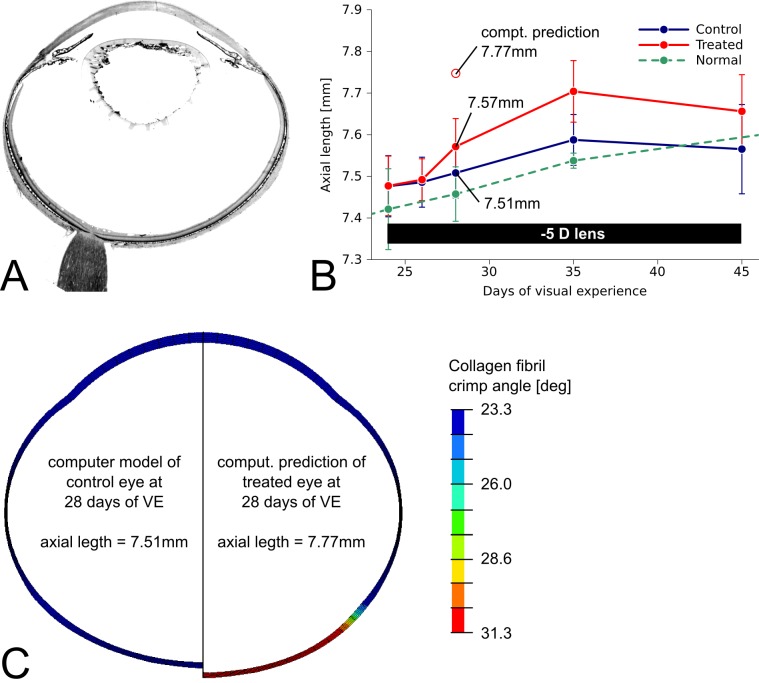
Figure 10.
(A) Histologic section of a tree shrew eye. (B) Axial length versus days of VE in normal, control, and −5 D lens–treated eyes (mean, SD) showing an increase in axial length in the treated eyes. (C) Axisymmetric computer models of the control (left-hand side) and the treated (right-hand side) tree shrew eye at 28 days of VE (4 days of −5 D lens wear). The contour plot represents the local distribution of the crimp angle parameter in the computer model. The experimentally obtained axial length (plot B) and fitted material parameters of the (mean) control eye were used to define the computer model of the control eye (left-hand side of C). Starting with the model of the control eye, the crimp angle parameter was changed from the fitted values of the control eye to the values of the treated eye in posterior sclera while IOP was kept constant (15 mm Hg). Increasing the crimp angle led to an increase in axial length in the computer model shown on the right-hand side of (C). The computationally predicted axial length overestimated the experimentally observed increase in axial length in the treated eye (see plot B).

