Figure 14.
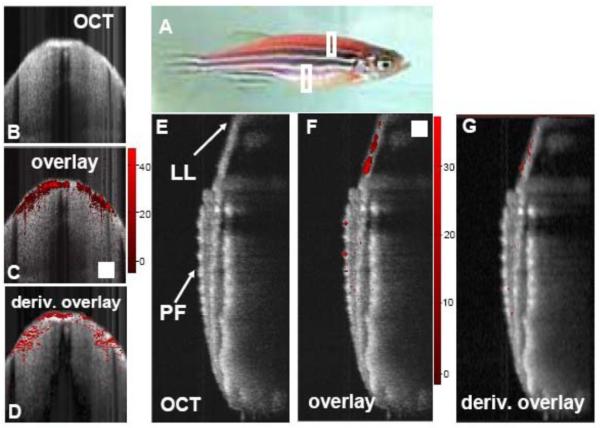
Fig. 5. A) Photo of transgenic zebra danio fish expressing dsRed in its skeletal muscle. B) OCT cross-section recorded through the back of the fish, anterior to the dorsal fin as indicated by the top white box in the photo. C) Overlay of the corresponding ground state recovery PPOCT (gsrPPOCT) image onto the OCT image in B. The color bar indicates the SNR of the gsrPPOCT signal (max 47 dB). D) Derivative image derived from panel C. E, F, G) Same as B, C, and D except recorded along a cross-section (bottom white box) bisecting the pectoral fin (PF) and continuing into the lateral line (LL). The maximum recorded SNR gsrPPOCT in panel E was 37 dB. The scale box is 200 μm×200 μm.Reprinted with permission from (89). Copyright 2008 Optical Society of America.

