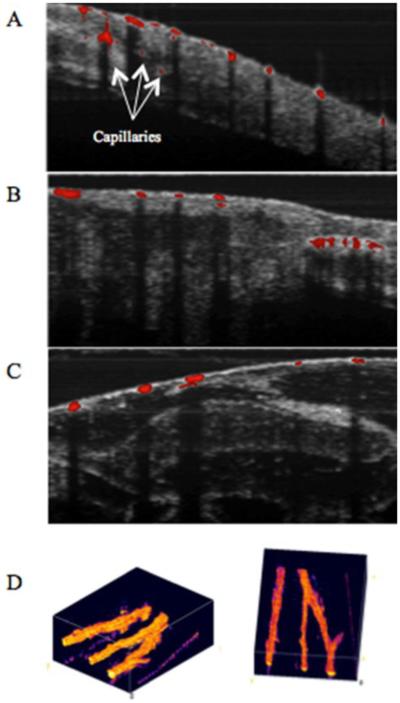
Figure 15.
(A), (B), and (C) are PPOCT B-scans overlaid on the corresponding co-registered OCT B-scans. X. laevis vasculature are clearly depicted. Arrows in (A) point to capillaries that were not visible in conventional OCT. Scale bar is 100 μm. (D) Two views of a volumetric reconstruction of the PPOCT data recorded on a euthanized Xenopus tadpole. The volume is 2 mm × 2 mm × 1 mm. The lines in the lower left and right edges of the images are artifacts. Modified from (90). Copyright 2013 John Wiley & Sons, Inc.

