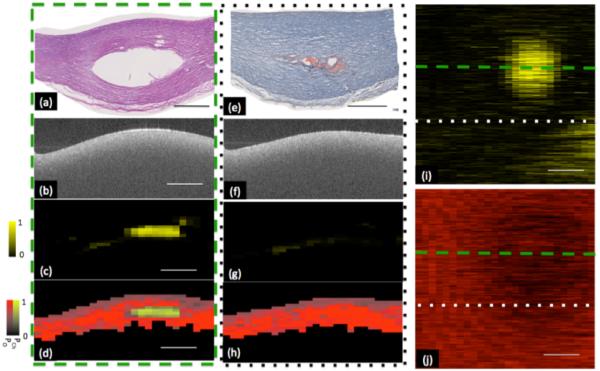
Figure 4.
Representative classification of lipid plaque phantom. Two sites within volumetric data set are shown in (a-d) and (e-h). (a,e) Histology taken through two cross sections within phantom plaque, showing void created by injection of fat emulsion. Corresponding H&E and oil-red-o stains respectively showing void created by the injection of a fat emulsion within center of plaque. (b, f) Optical frequency domain imaging (OFDI) image of phantom lipid plaque corresponding to histology shown in panels a and e respectively. OFDI image shown in panel b is taken through the center of the artificial plaque whereas panel f is taken from the edge of the plaque. (c,g) Probability of cholesterol image derived from the output of the classification algorithm. A high probability of cholesterol is measured from the OFDI image taken through the center of the plaque. A low probability of cholesterol is measured through the edge of the plaque. (d, h) Classification and probability image utilizing a Hue-Saturation-Value (HSV) convention where hue encodes class (red-other, yellow- cholesterol) and saturation and value encode probability. (i) Depth resolved integration of cholesterol probability. (j) Depth resolved integration of collagen probability. Within chemograms, lipid plaque can be seen as a circular region with increased cholesterol (i) and decreased collagen probability (j). Low probability of lipid was coded as black and high probability of lipid was coded as bright yellow. Low probability of collagen was coded as black and high probability of collagen was coded as bright red. Scale bar = 1mm. Reproduced from (60). Copyright 2013 Optical Society of America.

