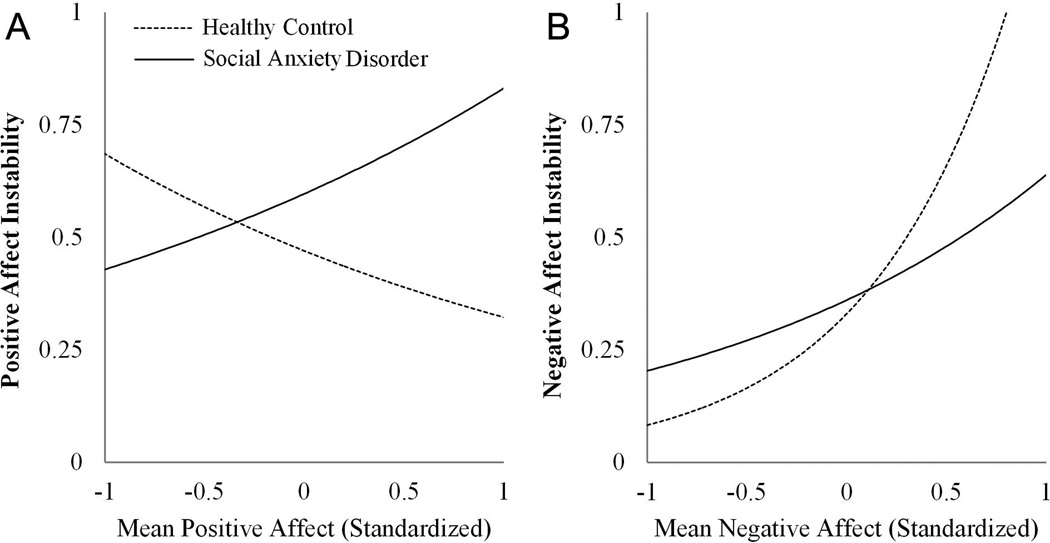
Figure 1. Effect of Diagnostic Group × Mean Daily Affect on Affective Instability.
Notes. These graphs demonstrate the differential effect of mean affect level on affect instability (squared successive deviations) for people with and without social anxiety disorder based on the fitted values from multilevel models. The x-axes represent the standardized mean levels (shown from −1 SD to +1 SD) for negative affect (a) and positive affect (b). All individual effects are significantly different from zero (p < .05).

