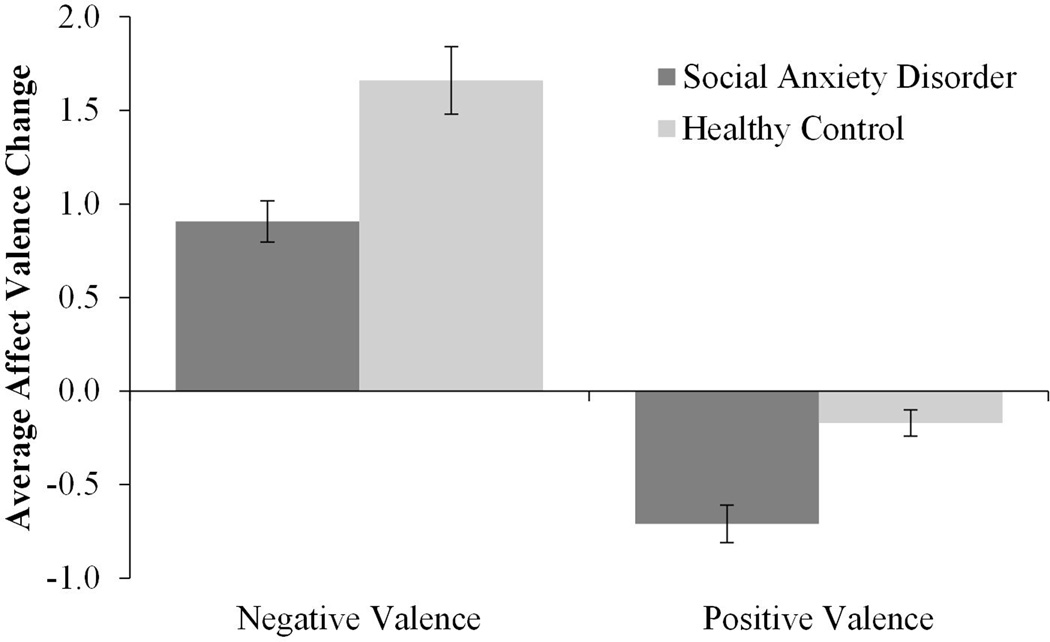
Figure 2. Average Affect Change from Positive and Negative Valence by Diagnostic Group.
Notes. This graph shows the mean direction and intensity of affect shifts (error bars represent standard error of the mean) from days with predominantly negatively valenced affect (Positive – Negative < 0) and positively valenced affect (Positive – Negative > 0). Differences were significant at p < .01.

