FIG. 1.

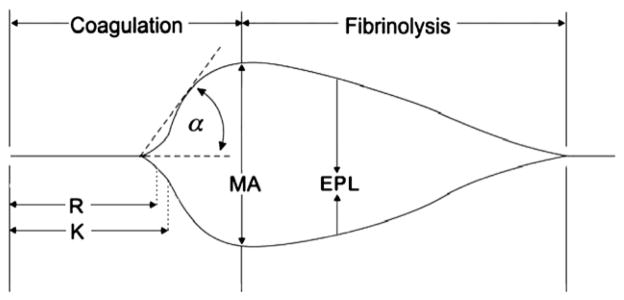
Depiction of thrombelastography (TEG) tracing and parameters measured throughout the clot’s lifespan. R = reaction time; K = coagulation time; α = alpha angle; MA = maximum amplitude; EPL = estimated percent lysis.

Depiction of thrombelastography (TEG) tracing and parameters measured throughout the clot’s lifespan. R = reaction time; K = coagulation time; α = alpha angle; MA = maximum amplitude; EPL = estimated percent lysis.