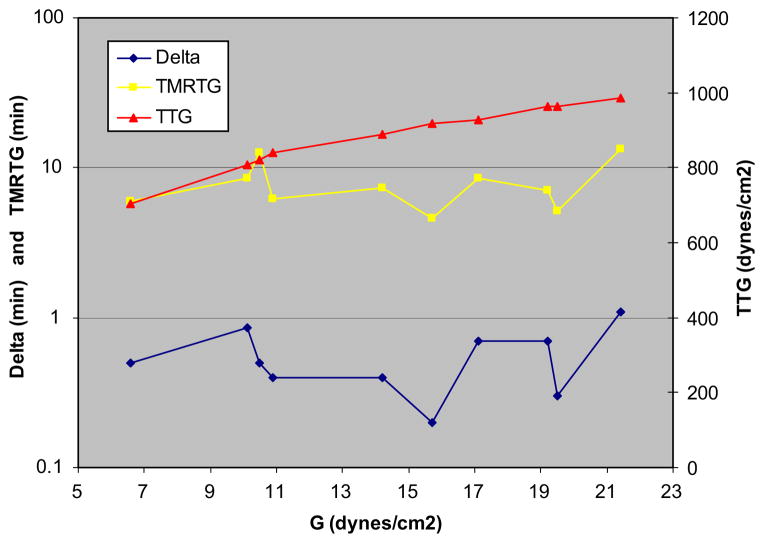
FIG. 4.
Changes in thrombelastography (TEG) and V-curve parameters are plotted against an increasing G (total clot strength). As expected, a linear correlation between G and TTG (total thrombus generated) occurred (r = 0.90), since G represents total clot strength. The varying contribution of platelets to hypercoagulability, results in a non-linear, weak correlation of the proposed enzymatic markers delta and TMRTG (time to maximum rate of thrombus generation) with G (r = 0.11 and r = 0.14, respectively). (Color version of figure is available online.)

