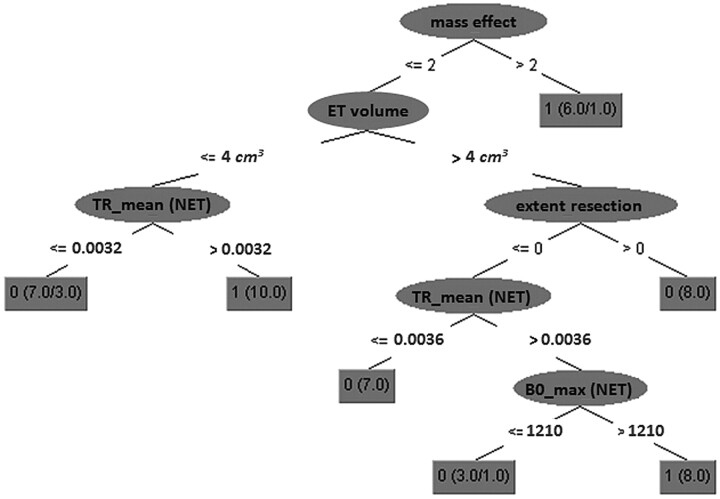
Fig 4.
A 5-node decision tree calculated from all training data (no cross-validation). The numbers in each gray box indicate the predicted class label (0, survival time <18 months; 1, survival time >18 months), the total number of samples from both classes satisfying the conditions of each tree path, and the number of misclassified samples (shown only if nonzero). TR indicates trace intensity; BO_max indicates maximum BO intensity.

