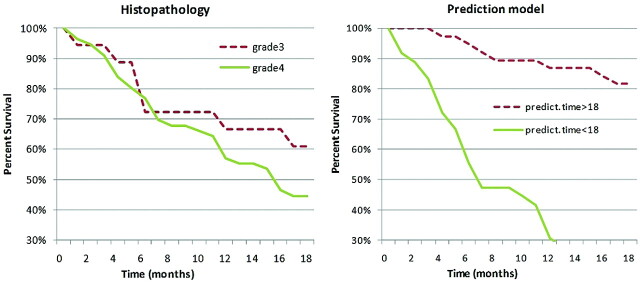
Fig 5.
Kaplan-Meier survival curves of patients with 56 gliomas of grade 4 and 18 anaplastic gliomas of grade 3. Survival curves were plotted according to classifications based on either traditional histopathology (dashed line, grade 3; solid line, grade 4) or the class prediction model (dashed line, predicted survival time >18 months; solid line, predicted survival time <18 months).

