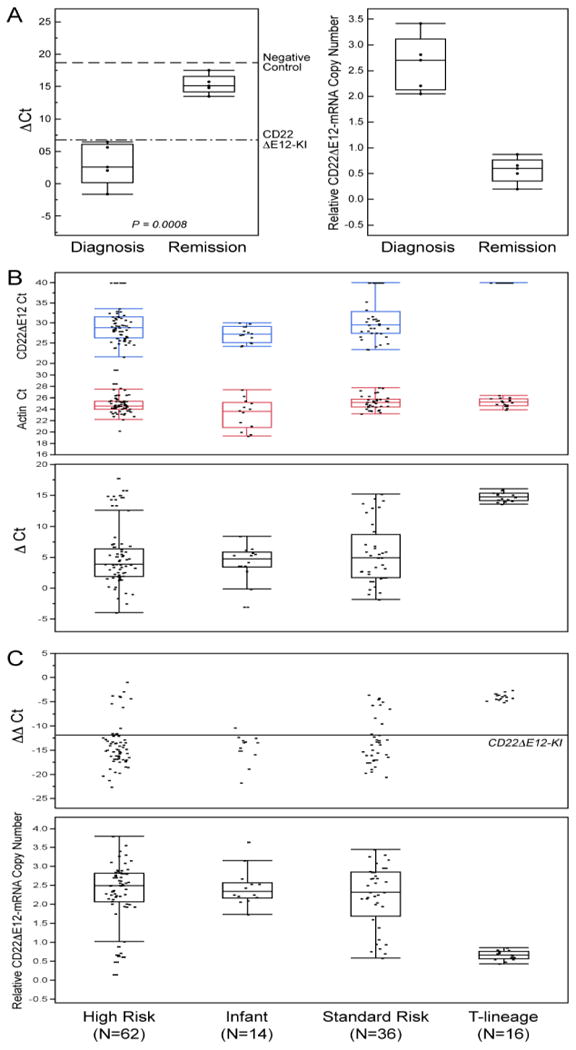
Figure 2. Detection of CD22ΔE12 mRNA in ALL Cells Using Quantitative RT-PCR.

[A] Quantitative RT-PCR analyses of 5 matched pair diagnosis vs. post-treatment remission bone marrow specimens from one standard-risk and 4 high-risk BPL patients demonstrated a marked reduction of the CD22ΔE12 mRNA levels after chemotherapy. Upper subpanel: Depicted are the ΔCt values for the paired samples at diagnosis and remission referenced to both negative (dashed line: CD22ΔE12-negative 293T cell line, mean ΔCt = 18.7 ± 2.8) and positive controls (Dotted/dashed line: splenocytes from CD22ΔE12-KI mice, mean ΔCt = 6.8 ± 3.3). There was a significant increase in ΔCt values (Paired T-test, P = 0.0008) comparing remission (15.3 ± 0.65) to diagnosis (3.02 ± 1.44) and a corresponding decrease in the relative copy numbers in these samples (Diagnosis = 2.64 ± 0.24 versus Remission = 0.57 ± 0.11). These findings indicate that CD22ΔE12 (at the transcript level detected by qRT-PCR) is a somatic defect that is unique to B-lineage leukemia cells. Lower subpanel: CD22ΔE12-mRNA copy number estimations were performed by comparing the ΔΔCt values of the samples to the CD22KI positive controls and depicted using dot plots. A decrease in the relative CD22ΔE12-mRNA copy number was observed at remission (Relative copy number at diagnosis = 2.64 ± 0.24 (Median = 2.71, Range = 2.05-3.41)) vs. Relative copy number at remission = 0.57 ± 0.11 (Median = 0.61, Range = 0.20-0.87). [B & C] We used the Applied Biosystems 7900HT Fast Real-Time PCR System. The PCR primer pair was designed to amplify a 113-bp fragment spanning from Exon 11 to Exon 13 of the human CD22 cDNA. The amplified fragment was then specifically annealed to a pre-mixed oligo DNA probe (5′-TGTGAGGAATAAAAAGAGATGCAGAGTCC-3′) conjugated with 5′ FAM reporter and 3′BHQ Quencher on the CD22ΔE12-specific unique junction region between Exon 11 and Exon 13. A normalization procedure employing actin RT-PCR results was utilized to calculate the delta (Δ)Ct values. The ΔΔCt values were determined by subtracting the mean ΔCt value for negative controls (viz., 293-T human kidney cell line; mean delta Ct = 18.7 ± 1.6) from the ΔCt values for each sample. The mean ΔΔCt for the homozygous CD22ΔE12-KI splenocytes (positive control) was -11.9 ± 3.3. Depicted are dot plots overlaid with Box-whisker plots (median, inter-quartile range boxes (IQ), 1.5 × IQ whiskers) to visualize distribution of Ct values for CD22ΔE12 and actin transcripts as well as ΔCt values (Panel B), ΔΔCt values (Panel C) in primary leukemia cells from newly diagnosed patients with high-risk BPL (N=62), infant ALL (N=14), standard-risk BPL (N=36), and T-lineage ALL (N=16). Significant differences in ΔΔCt values were observed across the ALL sub-types (ANOVA, F3,124 = 25.1, P<0.0001) and all 3 BPL subtypes expressed significantly higher levels of CD22ΔE12 than the T-precursor subtype (Dunnett's post-hoc, P<0.0001 for High Risk, Standard Risk and Infant ALL versus T-precursor ALL). The positive control cells contained 2 copies of CD22 Δ E12 enabling copy number calculations for each sample using the formula, Copy number = ΔΔCt sample/-11.9 × 2, and depicted using the dot plot overlaid with the Box-Whisker plot (Panel C, lower subpanel). Median and inter-quartile copy number ranges for high-risk BPL, Infant ALL, standard-risk BPL and T-lineage ALL were 2.5 (2.07-2.82), 2.34 (2.16-2.57), 2.32 (1.68-2.86) and 0.66 (0.56-0.76) respectively. [A-C] Distribution of the data are depicted using an outlier Box-Whisker plot (JMP v10, SAS, Cary, NC). The vertical line within the box represents the median sample value, the boxes represent the 75th and 25th quantiles, and the whiskers represent the 3rd quartile + 1.5*(interquartile range) and 1st quartile - 1.5*(interquartile range) if outliers are observed, or upper and lower data point values if outliers are not observed.
