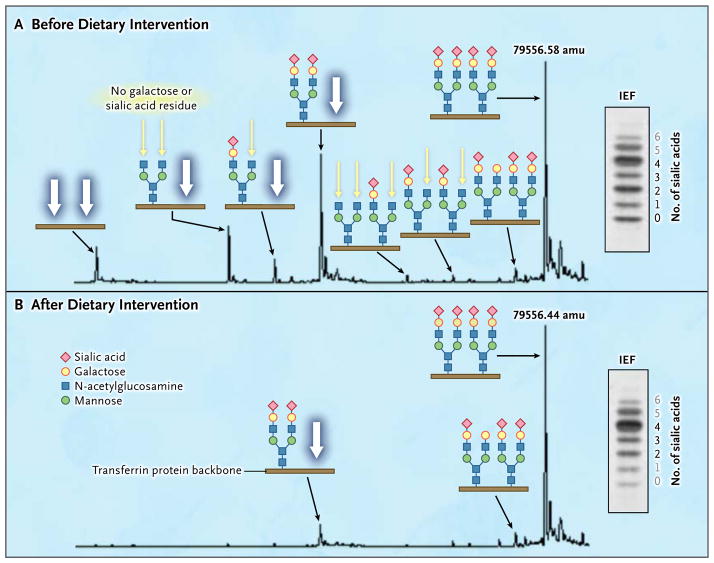
Figure 3. Effects of Dietary Galactose on Protein Glycosylation.
The results of mass spectrometry of the intact transferrin protein and corresponding transferrin IEF profiles are shown before (Panel A) and after (Panel B) the intake of supplementary galactose. The glycan structures are shown in detail with the transferrin protein backbone (brown line). Patients with PGM1 deficiency have highly specific transferrin glycosylation profiles. Data from Patient 2 show several peaks indicating the presence of glycoforms completely lacking one or both N-glycans (white arrows), a finding that is also observed in CDG-I. There are also peaks indicating the presence of glycoforms with truncated glycans lacking galactose (ending with N-acetylglucosamine; yellow arrows). Several structures end this way, which is typically seen in CDG-II. Numbers at main peaks are deconvoluted mass (amu). Numbers next to the IEF results indicate individual bands corresponding to numbers of sialic acid residues (black numbers indicate structures shown along the respective mass spectrum, and gray numbers structures not shown). After the patient increased dietary intake of galactose, protein glycosylation was substantially improved (Panel B). Peaks indicating the presence of glycoforms with truncated glycans lacking galactose almost completely disappeared, and peaks indicating the presence of glycoforms with complete loss of one or both N-glycans were considerably reduced. For details on the method and quantification of isoforms by means of liquid chromatography–mass spectrometry, see the Supplementary Appendix.

